Contact Us
Subscribe to Causeway Insights, delivered to your inbox.
One of our clients recently asked us about Morningstar’s Style Box “Blend” designation for the Causeway International Value Fund. Does this signal change at Causeway to investigate? Our short answer is no—but let’s investigate.
CAUSEWAY’S HISTORICAL STYLE
The Morningstar Style Box can help investors quickly visualize an estimate of a manager’s investment approach and serve as a starting point for comparing different funds. However, further research is essential to understand a manager’s investment philosophy and process.
Since its inception, Causeway has consistently applied the same value investment process to international markets, supported by a stable team—Causeway portfolio managers have an average tenure of 19 years with our firm as of June 30, 2024. Our investment process seeks to be dynamic to respond to market opportunities. This time-tested process yields portfolio characteristics that generally change with the investment opportunity set.
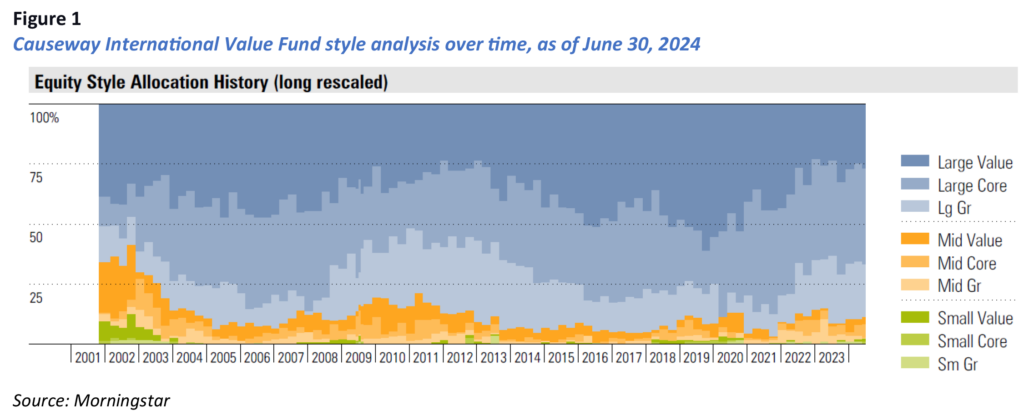
Figure 1 below shows Morningstar’s history of Causeway’s International Value Fund style exposure. Since the Fund’s inception in 2001, Causeway’s style has moved between value and core categorizations. During client portfolio reviews, we often point out that the portfolio characteristics are between Core and Value. This has typically been true historically and is true currently (as of the last quarter-end). This is partially explained by Causeway’s efforts to avoid significant exposure to low-quality stocks in the value index (aka “value traps”).
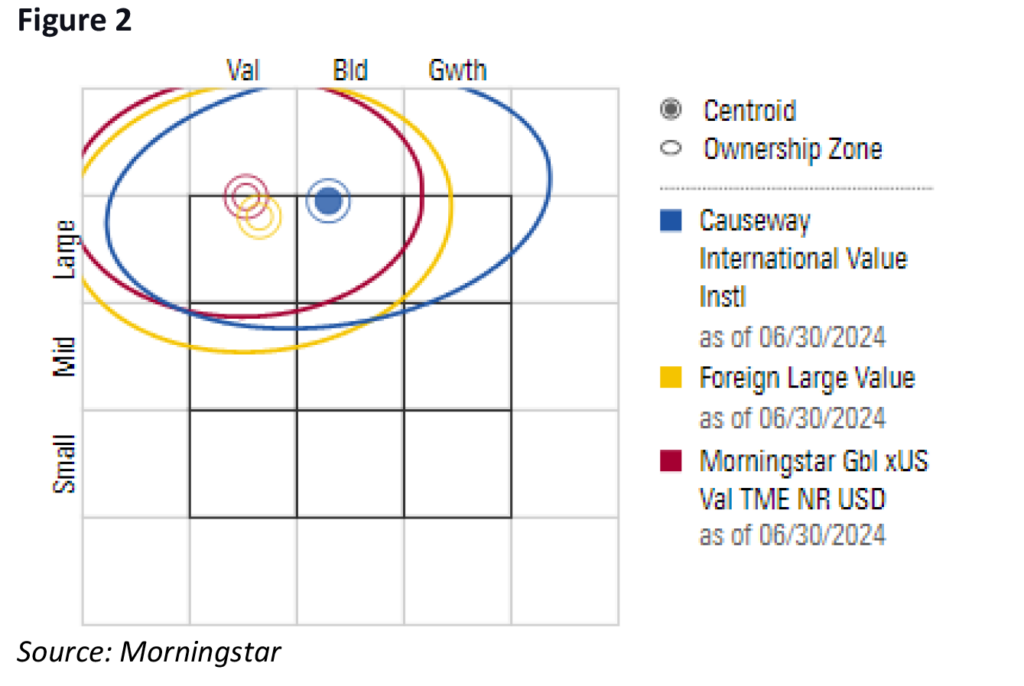
We should note that migrating from one style box to another isn’t unusual or unique to Causeway. Morningstar added historical ranges to its style box grid to help visualize this phenomenon. For example, see Causeway International Value Fund (CIVIX) in Figure 2.
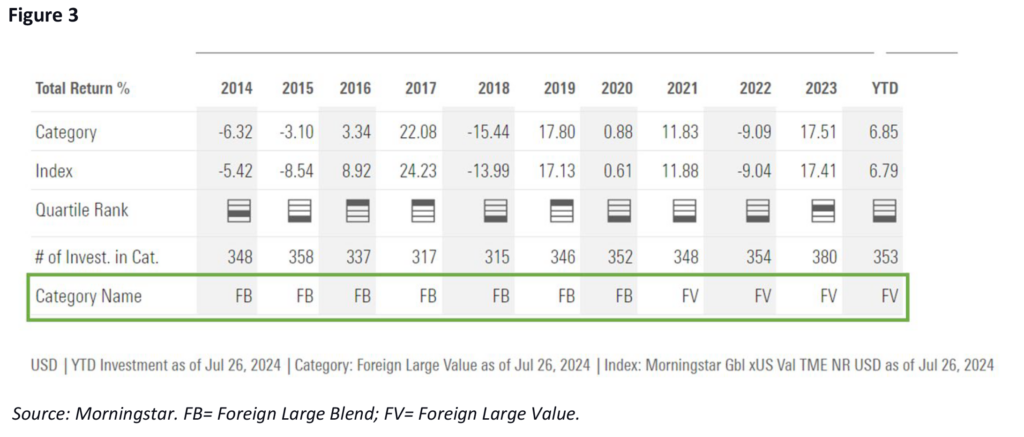
In Figure 3 we look at a manager known for “deep value.” This manager’s fund has spent years in Morningstar’s Category Classification of Foreign Large Blend (FB). It is probably fair to say that active management requires some flexibility beyond standardized style classifications.
VALUATION TECHNIQUES
As mentioned earlier, one of the benefits of style box analysis is speed and consistency. The valuation techniques are simplified and standardized for use across diverse investments. However, a particular manager’s approach to valuation will almost certainly be different than Morningstar’s standardized approach. Causeway, for example, uses a range of valuation methodologies based on a particular investment. Furthermore, Causeway focuses on two-year price targets, which typically require more judgment than historical earnings or shorter-term estimates.
To estimate valuation, Morningstar uses 50% trailing and 50% forward numbers, which do not include two-year estimates. This is a critical difference, essential for understanding Causeway’s current categorization.
Causeway likes to buy shares in companies with improving earnings profiles – ideally buying them at trough, or cycle-low, earnings. In such cases, a simple reading of a readily available earnings multiple can be misleading.
For example, assume a $10 stock in the banking industry consistently earning $1/share—it would trade at a 10x multiple. However, that company may have had some temporary issues or business cyclicality causing earnings to fall to $0.25/share last year, but Causeway expects it to return to earning $1/share in two years. (We love buying stocks like these.) We might say, “We know the company, met with management, and believe they’re making prudent decisions. It used to trade at 10x earnings, and we think it will again in the next two years.” As simple as this sounds, a surface-level reading of earnings would show this stock trading at 40x last year’s earnings and 20x next year’s earnings.

Style boxes struggle with stocks like the bank example above because earnings can grow quickly off the trough. In this example, the bank’s earnings will double this year and double again next year. Does this make it a high-multiple growth stock? No, because earnings, like the multiple, will most likely revert towards the company’s longer-term trend.
Causeway understands this. Morningstar does, too, but they do not tailor their methodology for each investment they analyze, nor should they. Customizing the analysis would spoil the speed and consistency that characterize the style box grid. Company-specific research and valuation is the work of an active manager like Causeway.
Looking at Causeway’s International Value Fund, we see many examples of high trailing multiples and more reasonable forward multiples. In Table 2, we examine the top ten highest multiple stocks based on last year’s earnings (LTM) and compare them with their multiple based on two-year forward estimated earnings (FY2). For this subset of high multiple holdings, the average trailing price-to-earnings (P/E), a stock’s share price divided by the last twelve months’ earnings-per-share is 47x, and the average FY2 P/E is 20x.
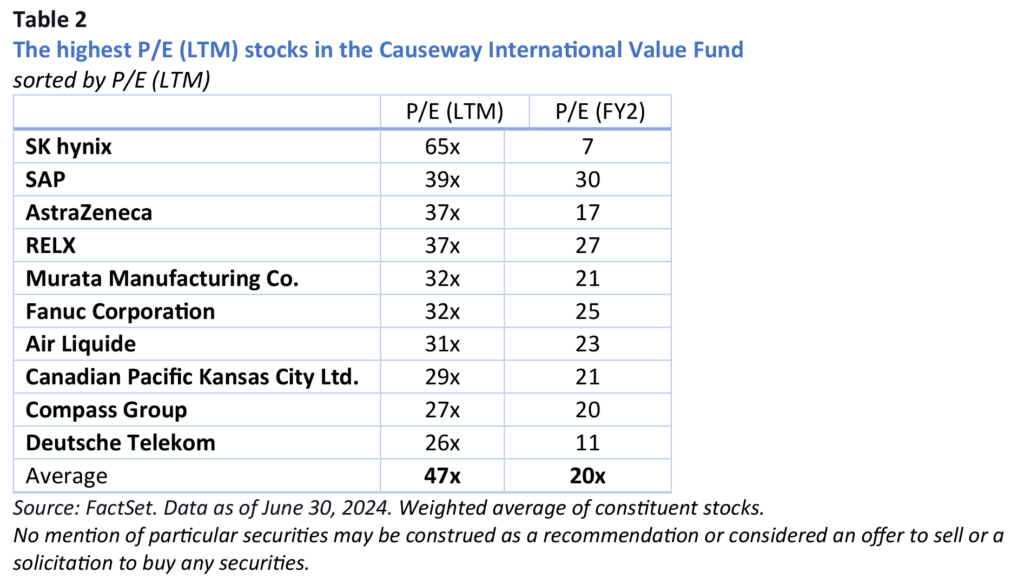
For context, as of June 30, 2024, for the overall portfolio, Causeway International Value’s FY2 P/E multiple was 11x, right between Core and Value as referenced earlier.

PERFORMANCE ANALYSIS
What has driven Causeway’s strong investment returns, and is this consistent with what we expect? The short answers are “value stocks” and “yes.”
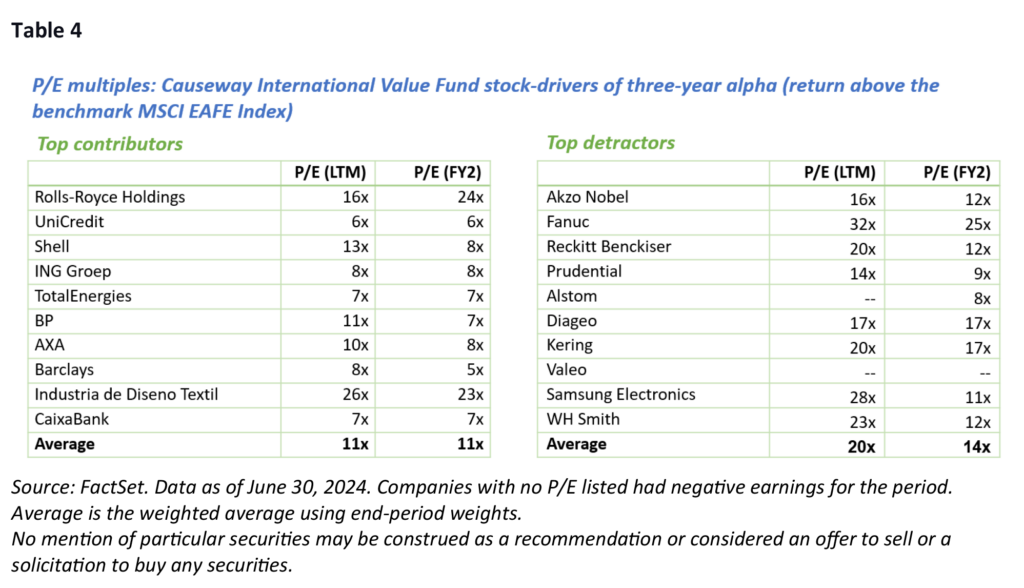
Both share classes of Causeway’s International Value Fund (CIVIX and CIVVX) have outperformed the broad market international equity benchmark, MSCI EAFE Index (Gross and Net), by more than 3.5% annualized for the three years to June 30, 2024. The top ten relative contributors over that period are listed below. Their weighted average earnings multiples (LTM and FY2) are 11x. The top ten relative detractors over the same period should have, in our view, more earnings and share price recovery to go. We believe that upside is reflected in higher multiples and more precipitous drops between trailing and forward P/Es.
CORRELATIONS
Does Causeway still provide diversification benefits when paired with a growth manager? The short answer is “yes.”
As a proxy for “Growth,” we use Vanguard’s International Growth Fund (VWILX), which employs two growth-oriented subadvisors. Correlations can change over time, especially for actively managed portfolios, so we review three lookback periods for realized active correlations. In Table 5, you can see that Causeway’s active returns (fund returns – MSCI EAFE Index returns) are uncorrelated or negatively correlated with this multi-manager international growth fund.

Key insights
- Causeway has consistently applied the same value investment process to international markets, adapting to market opportunities without altering our philosophy.
- Standardized style designations may not capture nuanced valuation techniques, such as two-year forward and normalized earnings multiples.

The performance data quoted herein represents past performance. Past performance is not a guarantee of future results. The investment return and principal value of an investment will fluctuate so that an investor’s shares, when redeemed, may be worth less than their original cost, and current performance may be lower than the performance quoted. For performance data current to the most recent month end, please call 1.866.947.7000. Returns greater than one year are annualized. Total returns assume reinvestment of dividends and capital gains distributions at net asset value when paid. Investment performance reflects contractual fee waivers. In the absence of such fee waivers, total return would be reduced. Investor Class shares charge up to a 0.25% annual shareholder service fee. High relative or absolute performance may not be repeatable. High relative or absolute performance may not be repeatable.
To determine if the Causeway International Value Fund is an appropriate investment for you, carefully consider the Fund’s investment objectives, risk factors, charges and expenses before investing. Please read the summary or full prospectus carefully before you invest or send money. To obtain additional information including charges, expenses, investment objectives, or risk factors, or to open an account, call 1.866.947.7000, or visit us online at www.causewayfunds.com.
This commentary expresses Causeway’s views as of July 2024 and should not be relied on as research or investment advice regarding any stock. These views and any portfolio holdings and characteristics are subject to change. The securities identified and described do not represent all of the securities purchased, sold, or recommended for client accounts. Our investment portfolios may or may not hold the securities mentioned. The reader should not assume that an investment in the securities identified was or will be profitable. There is no guarantee that any forecasts made will come to pass. Forecasts are subject to numerous assumptions, risks, and uncertainties, which change over time, and Causeway undertakes no duty to update any such forecasts. Information and data presented has been developed internally and/or obtained from sources believed to be reliable; however, Causeway does not guarantee the accuracy, adequacy, or completeness of such information.
Investing involves risk, including possible loss of principal. Diversification may not protect against market risk. International investing may involve risk of capital loss from unfavorable fluctuations in currency values, from differences in generally accepted accounting principles, or from economic or political instability in other nations. Please see https://www.causewaycap.com/wp-content/uploads/Risk-Disclosures.pdf for additional information on the risks of investing using Causeway’s strategies, as well as information regarding certain indices referenced in market commentaries.
Effective January 26, 2024, the Fund’s benchmark changed from the MSCI EAFE Index (Gross) to the MSCI EAFE Index (Net). The MSCI EAFE Index (Gross) is calculated to reflect reinvestment of distributions without any deductions for tax withholdings on such distributions. The MSCI EAFE Index (Net) is calculated to reflect reinvestment of distributions after accounting for tax withholdings on such distributions by applying a maximum assumed tax withholding rate. The Fund believes “net” benchmarks are regularly used by other registered investment companies and generally better align with the tax impact on the Fund’s foreign security holdings.
The MSCI EAFE Index is a free float-adjusted market capitalization index that is designed to measure the equity market performance of developed markets, excluding the U.S. & Canada. The MSCI Value variation is a subset of the referenced index, and target 50% coverage of the index, with value investment style characteristics for index construction using three variables: book value to price, 12-month forward earnings to price, and dividend yield. The indices are gross of withholding taxes, assume reinvestment of dividends and capital gains, and assume no management, custody, transaction or other expenses. It is not possible to invest directly in these indices. MSCI has not approved, reviewed, or produced this report, makes no express or implied warranties or representations and is not liable whatsoever for any data in the report. You may not redistribute the MSCI data or use it as a basis for other indices or investment products. Accounts will not be invested in all the constituent securities of their benchmark indices at all times, and may hold securities not included in their benchmark indices.
Index returns are for illustrative purposes only and do not represent actual fund performance. Index returns do not reflect any management fees, transaction costs or expenses. Indexes are unmanaged and one cannot invest directly in an index. Past performance does not guarantee future results.
©2024 Morningstar, Inc. All Rights Reserved. The information contained herein: (1) is proprietary to Morningstar; (2) may not be copied or distributed; and (3) is not warranted to be accurate, complete or timely. Neither Morningstar nor its content providers are responsible for any damages or losses arising from any use of this information. Past performance is no guarantee of future results.
Causeway Risk Lens is an investment analysis tool for investment professional use only. Risk Lens is not intended to be relied on for investment advice and is for illustration only. Carefully review the important disclosures that accompany Risk Lens reports.
Causeway Capital Management LLC serves as investment adviser for Causeway International Value Fund. The Fund is distributed by SEI Investments Distribution Co. (SIDCO), which is not affiliated with Causeway Capital Management LLC.
