Contact Us
Subscribe to Causeway Insights, delivered to your inbox.
Smaller capitalization stocks, or "small caps," have a fairly consistent record of outperforming larger stocks over the last several decades. But many institutional and retail investors have minor exposure to the asset class, especially to international small caps. Some view the asset class as unimportant, having only a marginal impact on returns and not worth the extra effort to examine. Others view small caps as too risky, with smaller companies typically exhibiting much higher volatility than their larger peers. We argue that the decision to avoid smaller stocks may have potentially significant ramifications for a broad equity portfolio, both in terms of return and risk. We believe that small caps offer meaningful diversification benefits with the potential to reduce, not increase, portfolio volatility. Finally, the highly idiosyncratic nature of small caps and the significant valuation dispersion observed make strong arguments for an actively managed approach.
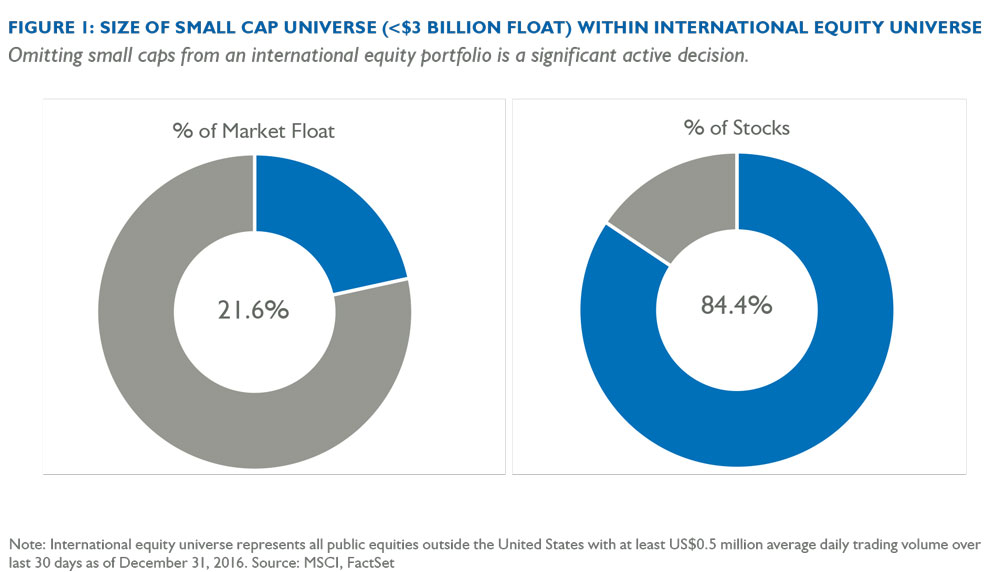
The goal of most diversified public equity portfolios is to achieve balanced exposure to the total world equity market. To do this, one must not only diversify by geography and sector, but also by capitalization. As a consequence, the decision to avoid smaller capitalization stocks represents an “active” decision leading to a potentially significant divergence in risk between a portfolio without small caps and the global opportunity set. In order to gauge the impact of this decision, we must first examine to what extent we would be narrowing the investment universe. Defining what is considered “small cap” is admittedly subjective. Within the MSCI ACWI ex USA Small Cap Index (referred to hereafter as the “International Small Cap Index”), we observe that the eight largest stocks all had float-adjusted market caps in excess of US$5 billion as of December 31, 2016, so that may serve as a guidepost for the high end of small cap. Using a more conservative $3 billion float cutoff, Figure 1 illustrates the percentage of total market float and the number of stocks that we would be excluding by avoiding these small caps. As of December 31, 2016, small caps represented 22% of total international market float and over 84% of international stocks by number. Omitting small caps turns out to be an important and impactful decision.
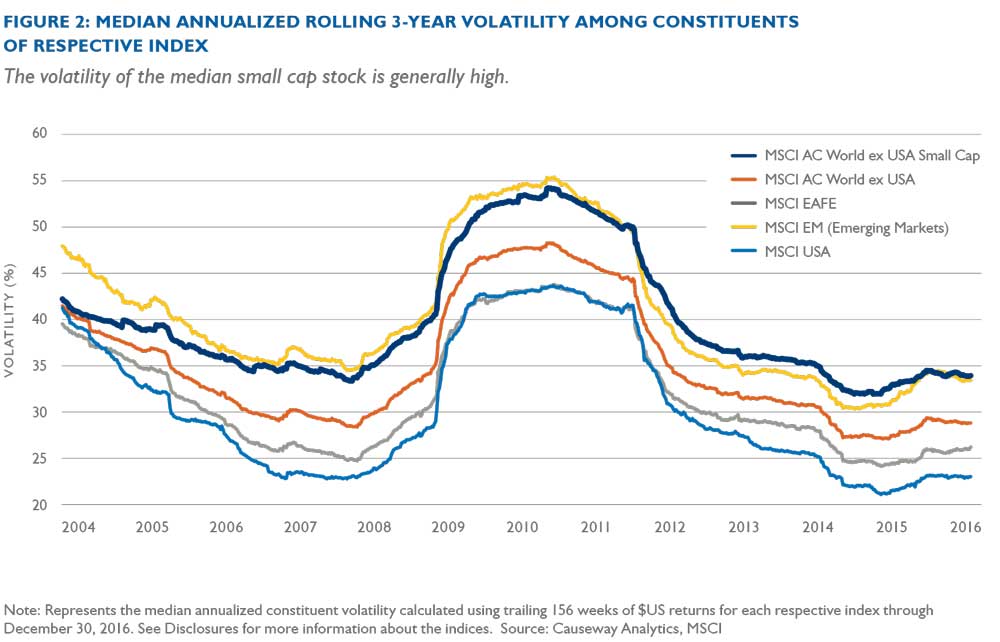
The general perception of small caps is that they are “riskier” stocks, and there are multiple data points that support this view. They may have more limited management depth and financial resources, and less access to financing. And compared to their larger cap peers, smaller companies are, on average, earlier in their lifecycle (more recent founding date), more dependent on a small handful of products (fewer product divisions), and more focused on their domestic geography to the exclusion of other countries (fewer geographic segments). More generally, small cap stocks tend to lack the internal revenue diversification that dampens overall volatility for larger cap stocks. Figure 2 confirms that the median stock in the International Small Cap Index currently exhibits higher annualized volatility than the median stock in other major indices, followed closely by the MSCI Emerging Markets Index.
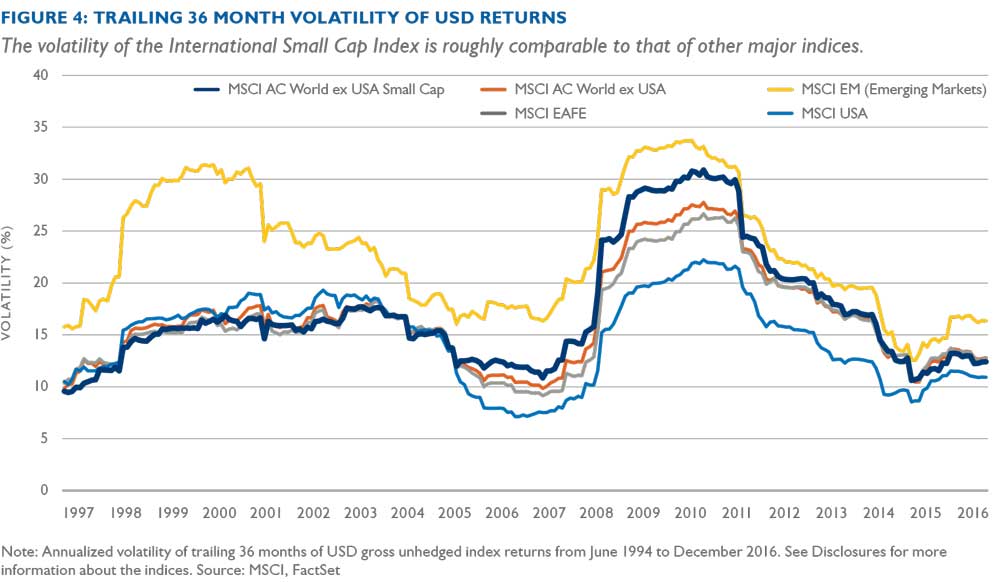
While small stocks may individually exhibit higher volatility than larger-cap stocks, the International Small Cap Index typically exhibits volatility in line with other (larger-sized) global indices, as illustrated in Figure 4. More recently, the trailing 36-month volatility of the International Small Cap Index is actually lower than the equivalent larger cap MSCI ACWI xUS Index as of December 2016.
How can this be, given the higher volatility of smaller stocks? The answer lies in how well the index constituents offset risks within the overall portfolio. It is worth reviewing how volatility is reduced by combining assets. Assuming a very basic portfolio of two stocks, A and B, with respective weights WA and WB, individual volatilities, δA and δB, and the correlation between them, ρAB, we can see how total volatility (δAB) is calculated.
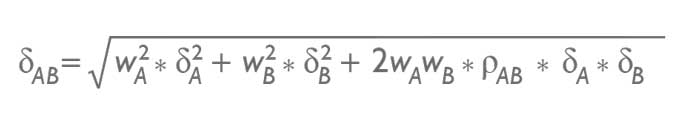
More simply stated, the volatility of the portfolio turns out to be a function of the individual stock volatilities in addition to the correlation between the two stocks.

Though the math gets much more complicated when considering a portfolio of hundreds of stocks, the main driver remains unchanged: The lower the correlation among constituent stocks, the more that total portfolio volatility is lowered by combining the stocks. In a large portfolio, we can measure the average correlation between all combinations of stocks to evaluate the benefits of correlation. Figure 5 shows the mean pairwise correlation for the International Small Cap Index over time and compares those values to other major market indices.
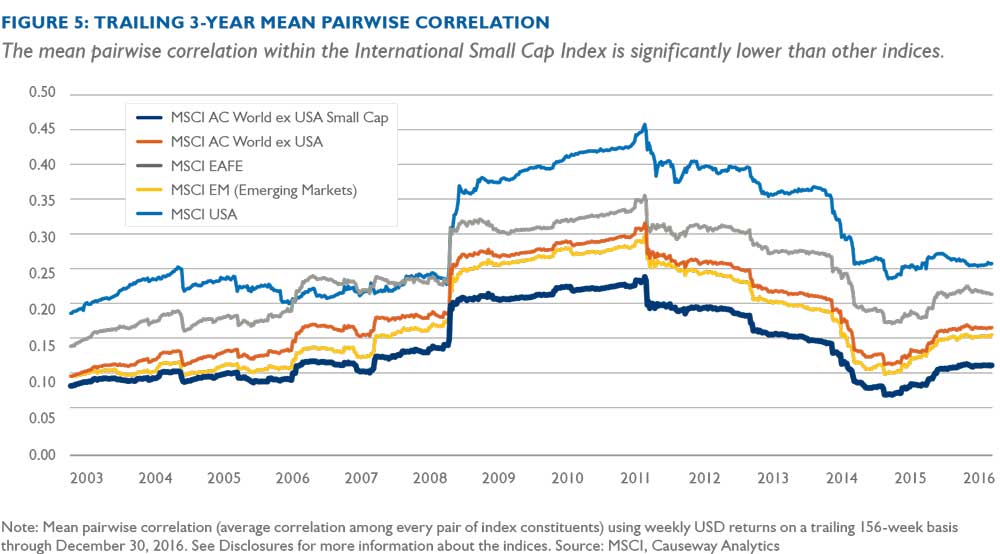
The International Small Cap Index has consistently offered the lowest median pairwise correlation, which tells us that returns on individual index constituents tend to be driven by unique sources. Until now, we have focused on the diversification benefits offered by this low degree of correlation. However, low correlation is a product of the highly idiosyncratic nature of small cap volatility, which also creates added opportunity for active managers.
The passive options for international small caps are significantly handicapped.
The argument for active management in small caps has been well-explored by others in the past, and the reasons become all the more compelling when considering international small caps. First, the passive options for international small caps are significantly handicapped. The sheer number of small stocks results in flat construction of small cap indices (the largest constituent of the International Small Cap Index was just 24 basis points of the index weight as of December 31, 2016) leading to sizable tracking errors for the few passive mutual funds and exchange-traded funds (“ETFs”) that attempt to mimic international small cap indices. Though there are currently no ETFs or mutual funds that track the International Small Cap Index, Vanguard advises an ETF which seeks to track the FTSE equivalent, the FTSE Global Small-Cap ex US Index. Over the past five years as of 12/31/2016, the Vanguard FTSE All World ex-US Small Cap Index Fund (ticker “VSS”) has generated a tracking error of 4.50%, a sizable spread for an index fund. For comparison, the tracking error of the Vanguard S&P 500 Index ETF (Ticker: VOO) was 0.43% vs. the S&P 500 Index over the same time period.
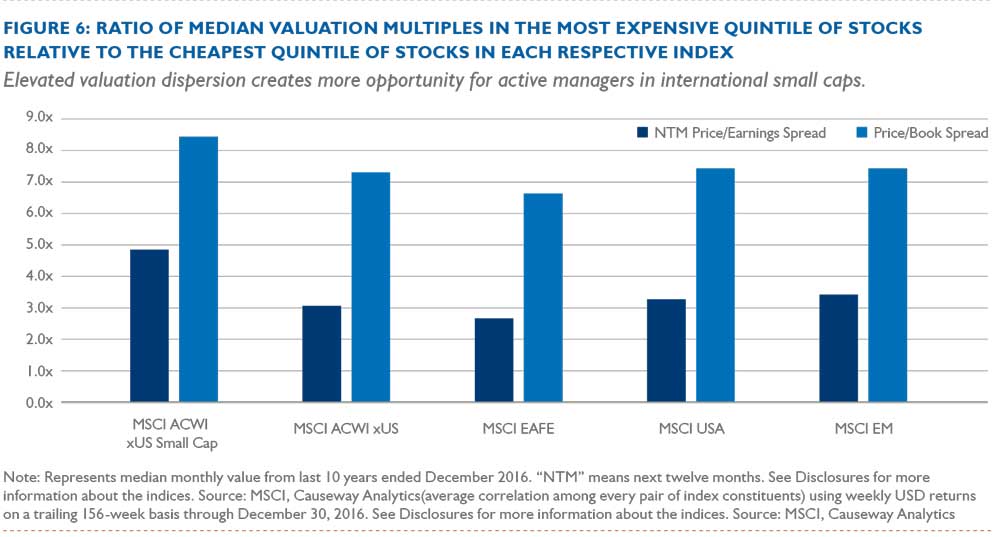
Second, the lack of attention to small caps creates opportunities. The home bias in investing, the scale economics of sell-side research, and the capacity-driven time allocation of many buy-side research teams lead to more inefficiency among international small caps. This elevated inefficiency is apparent when looking at the wide dispersion in valuations. Figure 6 compares the valuation multiples of the cheapest and most expensive quintiles of various indices. Specifically, we take the ratio of the median multiple in the most expensive quintile to the median multiple in the cheapest quintile, on both a price-to-book-value and price-to-forward-earnings basis. On both measures, the International Small Cap Index exhibits the highest dispersion in valuation ratios. The more extreme the dispersion, the greater the opportunities for active management to exploit pricing inefficiencies.
To react quickly to these pricing inefficiencies in a risk-conscious manner, the Causeway International Small Cap strategy uses a quantitative approach for stock selection and portfolio construction. We examine the small cap universe along four major factor dimensions to gauge return potential. The ideal candidate will exhibit relatively cheap valuations, accelerating earnings growth prospects, positive price momentum, and superior financial strength. We then rank the stocks using multiple factors in each of these categories to identify candidates that will produce the most attractive risk-adjusted returns. Unlike in the United States, where many small cap companies are very early in their life cycles, many of the small cap stocks that we encounter internationally are well-established, highly stable companies that just happen to be smaller in size. For instance, the average International Small Cap Index constituent was founded seven years earlier than the average constituent of the MSCI USA Small Cap Index (1973 vs. 1980), according to FactSet data.
In addition to maintaining a diversified portfolio across the many dimensions of risk, we seek to harness the alpha potential of strong stock selection.
Nevertheless, given the higher volatility of individual small cap stocks, we need to be particularly wary of concentrations in systematic risks. To address this issue, Causeway uses our proprietary risk model to assess portfolio risks along key systematic risk dimensions such as country, currency, sector, and style. The result is a diversified portfolio with a low number of stocks relative to the index. The diversification ratio measures the extent to which the volatility of overall portfolio returns is lower than the weighted average volatility of all constituents. A higher number signifies more benefits from diversification. As of December 31, 2016, the representative Causeway International Small Cap portfolio had a diversification ratio of 2.38 compared to the International Small Cap Index value of 2.39. At that date, the representative Causeway International Small Cap portfolio had a comparable level of diversification as the International Small Cap Index with only a fraction of the positions (113 stocks in the representative Causeway International Small Cap portfolio compared to 4,294 constituents in the International Small Cap Index).
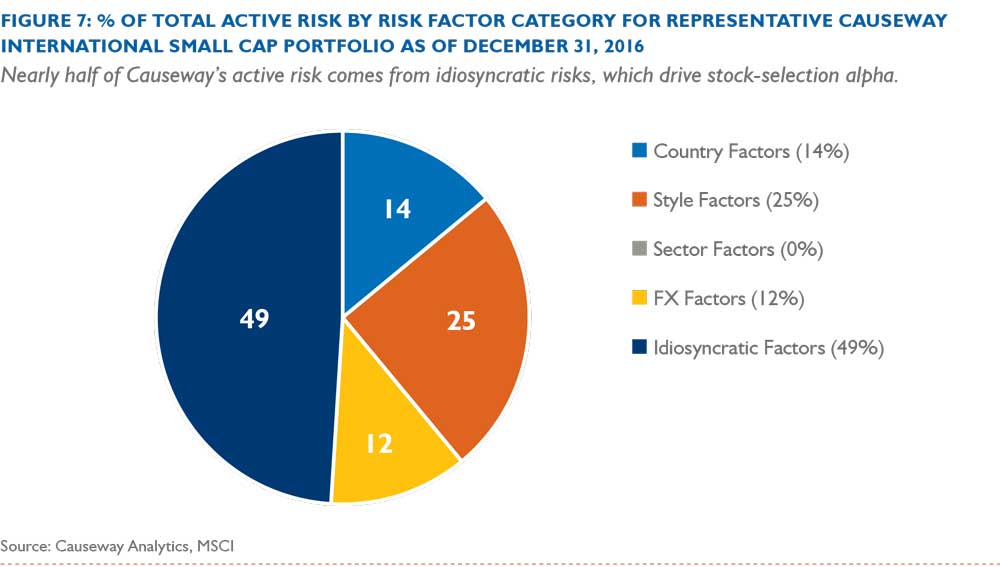
In addition to maintaining a diversified portfolio across the many dimensions of risk, we seek to harness the alpha potential of strong stock selection. The Causeway International Small Cap portfolio exhibited a 94% active share as of December 31, 2016. As we have detailed in a past newsletter, however, a high active share may result from a handful of major top-down factor decisions as opposed to many independent, stock-level decisions. As a proxy for the relative importance of stock selection, we prefer instead to measure the fraction of Causeway’s predicted active risk, or tracking error, driven by idiosyncratic risk. The decomposition of active risk in Figure 7 shows that nearly half of our active risk is attributable to idiosyncratic, stock-specific risks.
Though many investors have negligible exposure to international small caps, we argue that this decision can have a major impact on risk and returns in a broad global equity portfolio. Moreover, we believe in a properly constructed portfolio, small caps are not individually riskier than their large cap peers. Active stock selection in international small caps, when approached in a risk-conscious way, can be diversifying and beneficial to a broader portfolio.
Important Disclosures
Past performance is no guarantee of future performance. In addition to the normal risks associated with investing, international investments may involve risk of capital loss from unfavorable fluctuation in currency values, from differences in generally accepted accounting principles or from economic or political instability in other nations. Emerging markets involve heightened risks related to the same factors as well as increased volatility and lower trading volume. Investments in smaller companies involve additional risks and typically exhibit higher volatility.
The MSCI EAFE Index is a free float-adjusted market capitalization weighted index, designed to measure developed market equity performance excluding the U.S. and Canada, consisting of 21 stock markets in Europe, Australasia, and the Far East. The MSCI World Index is a free float-adjusted market capitalization weighted index, designed to measure developed market equity performance, consisting of 23 developed country indices, including the U.S. The MSCI Emerging Markets Index is a free float-adjusted market capitalization index, designed to measure equity market performance of emerging markets, consisting of 23 emerging country indices. The MSCI All Country World Index ex U.S. is a free float-adjusted market capitalization weighted index, designed to measure the equity market performance of developed and emerging markets excluding the U.S. consisting of 45 country indices. The MSCI ACWI ex USA Small Cap Index is a free float-adjusted market capitalization weighted index, designed to measure the equity market performance of smaller capitalization stocks in developed and emerging markets excluding the U.S. market, consisting of 45 country indices. The MSCI ACWI ex USA Small Cap Index covers approximately 14% of the free float-adjusted market capitalization in each country. The MSCI USA Index is a free float-adjusted market capitalization weighted index, designed to measure large- and mid-cap US equity market performance. The MSCI USA Index is a member of the MSCI Global Equity Indices and represents the US equity portion of the global benchmark MSCI ACWI Index. The Indices are gross of withholding taxes, assume reinvestment of dividends and capital gains, and assume no management, custody, transaction or other expenses. It is not possible to invest directly in these indices. The MSCI ACWI ex USA Small Cap Index was launched on June 1, 2007. The MSCI ACWI ex USA Index and MSCI Emerging Markets Index were launched on January 1, 2001. Data prior to the respective launch dates were backfilled by MSCI.
MSCI has not approved, reviewed or produced this report, makes no express or implied warranties or representations and is not liable whatsoever for any data in the report. You may not redistribute the MSCI data or use it as a basis for other indices or investment products.
“% of Total Active Risk by Risk Factor Category” in Exhibit 7 measures the marginal contribution to risk, as calculated by holdings-based fund-level risk exposures, and the historical covariance matrix of the risk factor returns, across 8 style dimensions, 11 sectors, different countries and currencies, as well as idiosyncratic risk. Risk contribution is measured for the fund’s “active” risk exposures relative to the benchmark index. “Active Share” is the proportion of stock holdings in a fund that are different from the holdings in its benchmark index. A fund with an active share score of 0 has identical holdings with the index; a fund with a score of 100 has no overlapping holdings with the index. “Alpha” is a measurement of performance return in excess of a benchmark index. “Diversification Ratio” is the ratio of the weighted average volatility of a portfolio’s holdings to its overall volatility. “Tracking Error” is the volatility of alpha over the stated preceding period.
Market Commentary
This market commentary expresses Causeway’s views as of January 31, 2017 and should not be relied on as research or investment advice regarding any investment. These views and any portfolio holdings and characteristics are subject to change, and there is no guarantee that any forecasts made will come to pass. Any securities referenced do not represent all of the securities purchased, sold or recommended by Causeway. The reader should not assume that an investment in any securities referenced was or will be profitable. Forecasts are subject to numerous assumptions, risks and uncertainties, which change over time, and Causeway undertakes no duty to update any such forecasts. Information and data presented has been developed internally and/or obtained from sources believed to be reliable; however, Causeway does not guarantee the accuracy, adequacy or completeness of such information.