Contact Us
Subscribe to Causeway Insights, delivered to your inbox.
Will the earnings of value stocks decline forever? Current market multiples for the MSCI Value indices appear extremely pessimistic, suggesting negative perpetuity growth for value stocks across all global geographies, even as the world economy is forecast to grow. It may surprise our readers that, since the market trough in 2009, value stocks have beaten growth stocks at their own game, having exhibited greater earnings growth. As the gap in implied earnings growth between value and growth stocks reaches new highs, we find the current value recession increasingly irrational.
Rationalizing the Irrational: Video Highlights
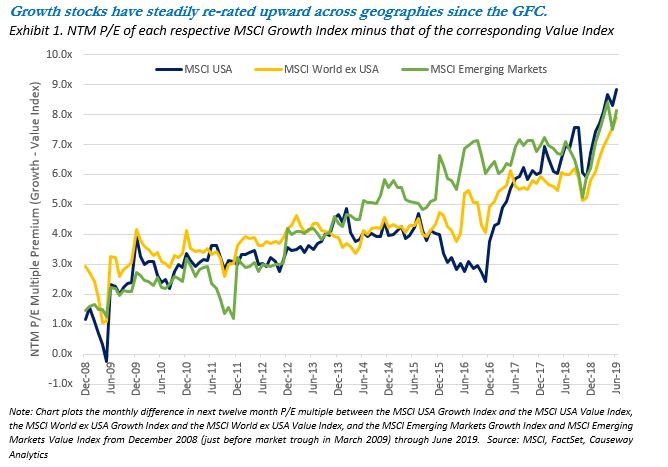
It is no secret that value stocks have underperformed growth stocks in recent years, but under the surface there has been a more pervasive trend at work. The market has gradually determined that the earnings of value stocks are worth far less than those of growth stocks. This is reflected in their relative multiples. Exhibit 1 plots the difference in the next twelve months’ price-to-earnings (NTM P/E) multiples between regional MSCI Growth and Value indices since December 2008, in the midst of the global financial crisis (GFC). Across all geographies, the gap has marched steadily wider over the last decade. And in the first half of 2019, we witnessed the spread increase sharply. As of June 30, 2019, the noted Growth indices traded at a 7-9x P/E premium to the Value indices.
Key insights
- Since the market trough in 2009, global growth stocks have rerated sharply upward while value stocks have been left behind
- Value stocks have surprisingly grown their earnings faster than growth stocks over the same period of time
- Market multiples for the MSCI Value indices currently imply negative perpetuity growth for value stocks across all global geographies, even as the world economy is forecast to grow
- To us, this is further evidence that the market has become irrationally optimistic about growth stocks relative to value stocks, and a reversion to the mean appears inevitable

What has caused such a divergence in appetite for these two styles? There are many potential explanations, but the reasons do not appear to be related to underlying earnings growth itself. Most investors naturally assume that “growth” stocks demonstrate greater earnings growth than “value” stocks, but that has not occurred, at least in aggregate, during the post-GFC bull market.
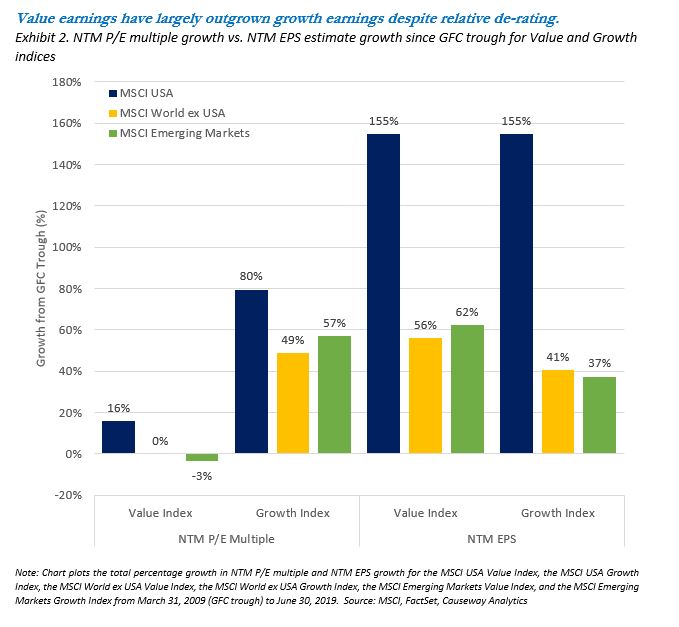
Outside of the United States, value-stock earnings have ironically grown more than growth-stock earnings over the same time period.
Exhibit 2 compares the total percentage change in P/E multiples with the total percentage change in NTM earnings per share (EPS) estimates for the Value and Growth indices across geographies. The left side of the chart shows that, as we saw in Exhibit 1, P/E multiples for Growth indices have grown much more than Value multiples in the period since the GFC market trough (in March 2009). More surprising is what we find on the right side of the chart examining relative growth in EPS. Outside of the United States, value-stock earnings have ironically grown more than growth-stock earnings over the same time period. Even in the United States, value stocks have kept up with the earnings growth exhibited by growth stocks and yet have witnessed only one-fifth of the upward “re-rating” of US growth stocks (16% vs. 80%).
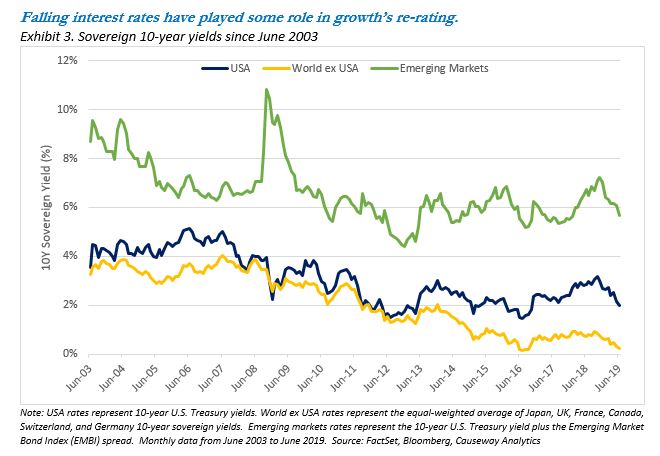
Recent growth outperformance is therefore not attributable to superior earnings growth, but solely to the market’s revaluation of those earnings. So what else might have caused this change in preference for growth stocks? Interest rates have undoubtedly played some role. Decreasing the discount rate applied to cash flows will necessarily increase their present value. Since growth stocks tend to have more of their cash flows expected in years far in the future (i.e., longer duration), lower interest rates should have a more positive impact on the present value of growth stocks relative to value stocks. Exhibit 3 charts the falling average 10-year yields in each geography. We use the Emerging Market Bond Index (EMBI) spread to US Treasuries as a proxy for average emerging markets sovereign rates.
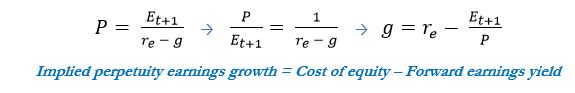
The enormous global wave of monetary liquidity has dragged down interest rates and inflated asset prices, but the impact on growth stocks appears to have been more pronounced. Given the changing interest rate regime, we need to incorporate interest rates and costs of equity when analyzing the disparity between current valuation multiples of value and growth indices. To do this, we can use the Gordon Growth Model framework, which equates the price of a stock (P) to its growing stream of future earnings per share (Et+1 growing by g), assuming all earnings are paid as dividends, discounted by its cost of equity (re). Solving for g, the market-implied perpetuity growth rate is equal to the cost of equity minus the forward earnings yield.
In order to calculate the cost of equity, we use the Capital Asset Pricing Model (CAPM) assuming a trailing 36-month beta of each style index to the relevant benchmark index and a fixed 5% equity risk premium (ERP). This framework should capture the impact of interest rates, and the higher beta (and cost of equity) of the growth indices. By solving for “g” we can observe what current market multiples imply about assumed future perpetuity earnings growth rates (see Exhibit 4). As the equation indicates, a higher implied perpetuity growth rate can result from a higher cost of equity and/or a lower forward earnings yield (higher P/E). The ERP assumption of 5% is admittedly subjective, however many academic studies suggest it may be lower, which would further depress the market-implied growth rates depicted below.
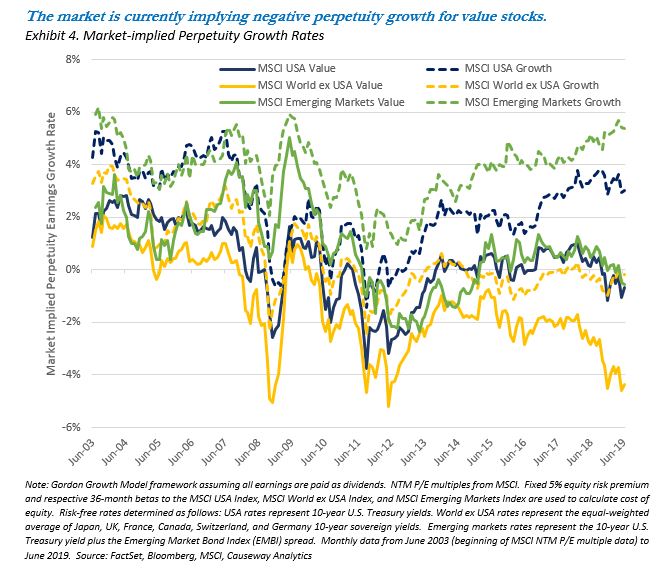
In the chart above, the solid lines represent the implied perpetuity growth for the Value indices and the dashed lines represent implied growth rates for the Growth indices. At current multiples, the market is assuming negative earnings growth in perpetuity for Value indices in all three regions.
The market suggests that these international value stocks, in aggregate, will see their earnings shrink by over 4% per year into perpetuity. This seems startlingly pessimistic.
Only the MSCI USA Growth Index and Emerging Markets Growth Index exhibit meaningfully positive implied growth rates. The lowest implied growth rate belongs to the World ex USA Value Index. The market suggests that these international value stocks, in aggregate, will see their earnings shrink by over 4% per year into perpetuity. This seems startlingly pessimistic. Assuming static profit margins, a 4% annual contraction in earnings translates into a 4% contraction in revenue. This negative implied earnings growth is substantially in conflict with current gross domestic product (GDP) growth forecasts. In its April 2019 World Economic Outlook, the International Monetary Fund (IMF) forecasts real GDP growth of 1.2% in Western Europe, 1% in Japan, and 1.5% in Canada. In nominal terms (to make them comparable to the Gordon Growth Model output), these would be even higher. The valuations of developed international stocks overall imply an excessively gloomy earnings outlook. Adding in the less bearish, but also negative, projected growth of international growth stocks (dotted yellow line) to the implied growth from international value stocks leaves earnings expectations well below international GDP forecasts.
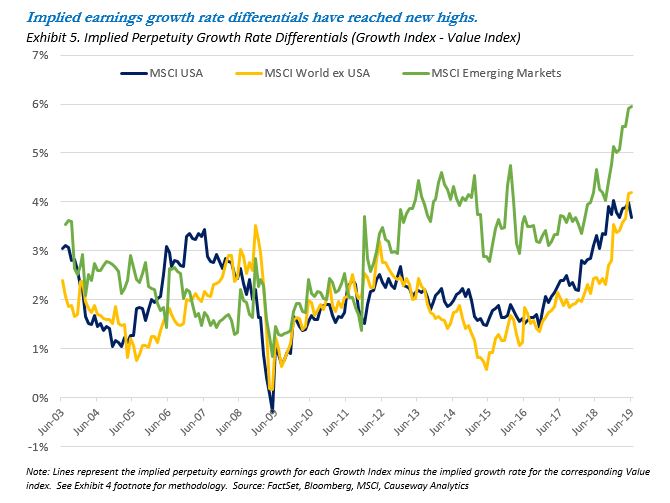
What is also surprising about these results is not just the absolute levels, but the spread between implied growth for value and growth indices. Exhibit 5 plots these differences between the dashed and solid lines from Exhibit 4. Focusing on the differences in implied growth rates also removes the impact of any equity risk premium assumptions since this term will effectively cancel out. The gap in implied growth rates in Exhibit 5 is especially dramatic outside of the United States, and recall from Exhibit 2 that in both of these geographic regions (World ex USA and Emerging Markets), value stocks have actually grown earnings faster than growth stocks since the GFC trough in 2009. We see these results as further evidence that the market has become irrationally optimistic about growth stocks relative to value stocks, and a reversion to the mean appears inevitable, even if timing cannot be predicted.
Summary
Have we truly reached peak earnings for value stocks into perpetuity? The market currently suggests that growth stocks represent breakthrough technologies with endless future profitability (even if elusive for now) and that value stocks are structurally broken. In reality, value stocks have demonstrated superior earnings growth since the GFC, and current market-implied negative perpetuity growth rates for value stocks are not consistent with more rational GDP growth estimates. Meanwhile, the current value recession, while painful in its length and depth, has continued to present Causeway many opportunities to invest in high-quality, out-of-favor value stocks at relative bargains.
This market commentary expresses Causeway’s views as of July 2019 and should not be relied on as research or investment advice regarding any stock. These views and any portfolio holdings and characteristics are subject to change. There is no guarantee that any forecasts made will come to pass. Forecasts are subject to numerous assumptions, risks and uncertainties, which change over time, and Causeway undertakes no duty to update any such forecasts. Information and data presented has been developed internally and/or obtained from sources believed to be reliable; however, Causeway does not guarantee the accuracy, adequacy or completeness of such information.
International investing may involve risk of capital loss from unfavorable fluctuations in currency values, from differences in generally accepted accounting principles, or from economic or political instability in other nations.
The MSCI USA Index is a free float-adjusted market capitalization index, designed to measure the performance of the large and mid cap segments of the US market. The MSCI USA Value Index is a subset of the MSCI USA Index, and targets 50% coverage of the MSCI USA Index, with value investment style characteristics for index construction using three variables: book value to price, 12-month forward earnings to price, and dividend yield. The MSCI USA Growth Index is a subset of the MSCI USA Index, and targets the remaining 50% coverage.
The MSCI World ex USA Index is a free float-adjusted market capitalization index, designed to capture large and mid cap segments across 22 of 23 developed markets countries, excluding the United States. The MSCI World ex USA Value Index is a subset of the MSCI World ex USA Index, and targets 50% coverage of the MSCI World ex USA Index, with value investment style characteristics for index construction using three variables: book value to price, 12-month forward earnings to price, and dividend yield. The MSCI World ex USA Growth Index is a subset of the MSCI World ex USA Index, and targets the remaining 50% coverage.
The MSCI Emerging Markets Index is a free float-adjusted market capitalization index, designed to measure the performance of the large and mid cap segments of 26 emerging markets countries. The MSCI Emerging Markets Value Index is a subset of the MSCI Emerging Markets Index, and targets 50% coverage of the MSCI Emerging Markets Index, with value investment style characteristics for index construction using three variables: book value to price, 12-month forward earnings to price, and dividend yield. The MSCI Emerging Markets Growth Index is a subset of the MSCI Emerging Markets Index, and targets the remaining 50% coverage.
These MSCI indices are gross of withholding taxes, assume reinvestment of dividends and capital gains, and assume no management, custody, transaction or other expenses. It is not possible to invest directly in an Index.
MSCI has not approved, reviewed or produced this report, makes no express or implied warranties or representations and is not liable whatsoever for any data in the report. You may not redistribute the MSCI data or use it as a basis for other indices or investment products.
“Gordon Growth Model” is used to determine the intrinsic value of a stock based on a future series of earnings (or dividends) that grow at a constant rate. Given an earnings per share (or dividend per share) that is payable in one year, and the assumption the earnings (or dividends) grow at a constant rate in perpetuity, the model seeks to solve for the present value of the infinite series of future earnings (or dividends).