Contact Us
Subscribe to Causeway Insights, delivered to your inbox.
The universe of international small capitalization (“cap”) stocks is unlike any other. We believe its inefficiencies and breadth provide the active investor a truly unique opportunity set. Because of their size, small caps generally receive much less attention from the sell-side and buy-side communities, and the home bias in investing further exacerbates this phenomenon among small caps outside the U.S. With more than twice the number of U.S. small cap stocks trading internationally, the active investor can access a much broader and diverse group of stocks by looking abroad. In most large cap universes, investors typically face tradeoffs in the characteristics of stocks. Want to build a value portfolio? Chances are you may have to sacrifice some growth and quality characteristics to achieve the inexpensive valuation. It is rare to find a stock with multiple attractive attributes, much less an entire portfolio of them.
Key insights
- The sheer breadth and inefficiency of the International Small Cap (ISC) universe create the opportunity to build a portfolio without the typical tradeoffs in stock characteristics.
- Causeway’s ISC strategy, harnessing multiple sources of alpha, has achieved an attractive combination of portfolio characteristics.
- Valuation matters, even in small caps, amidst global economic fears and rising interest rates.
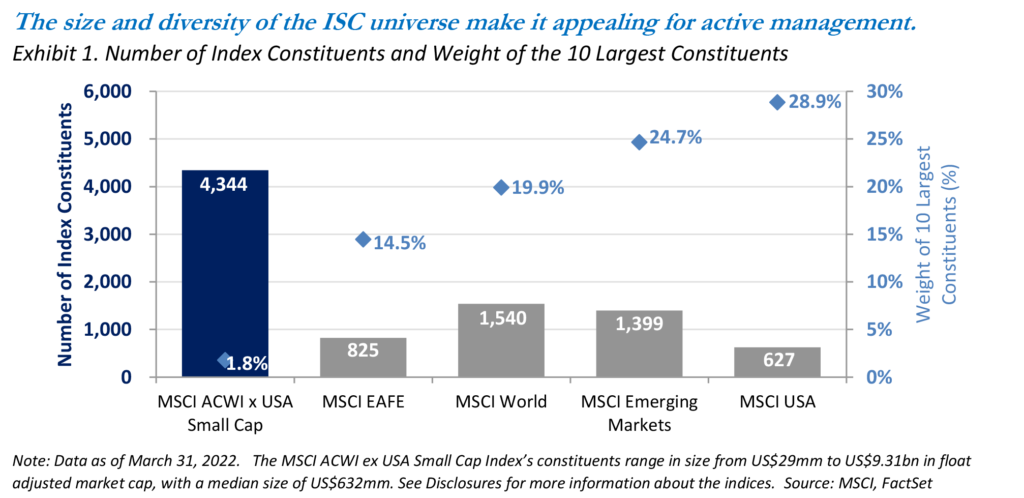
That’s not what we see within international small caps. The MSCI ACWI ex USA Small Cap Index (“ISC Index”) represents just 15% of international equities by market value in the MSCI ACWI ex US IMI Index, but small caps account for 65% of the broader index by number. With over 4,300 constituents in the ISC Index, the universe is vast. And since most of its constituents are similar in size, the ISC Index is not dominated by a handful of stocks. The largest ten members have a mere 1.8% weight in the ISC Index, a stock picker’s dream. Exhibit 1 juxtaposes these statistics with those of various larger cap indices, each of which contains fewer stocks and higher concentration.
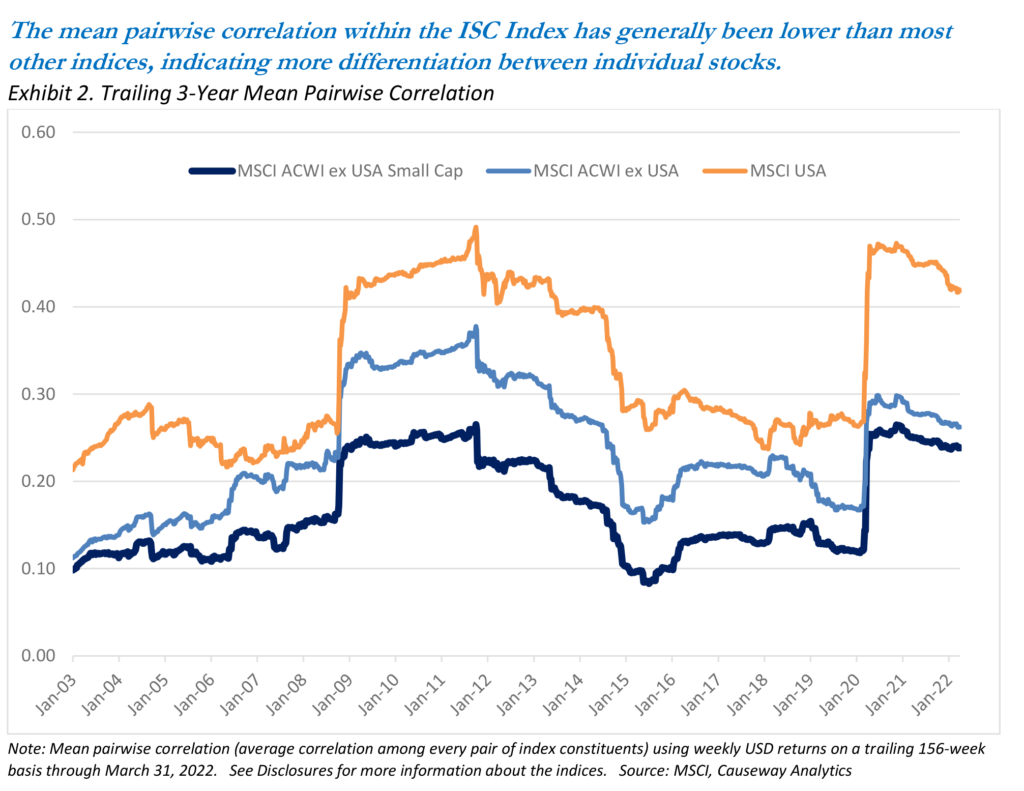
Not only is the ISC Index far less concentrated than various other indices, but the individual constituents are much more differentiated. One gauge of differentiation is the mean pairwise correlation, the average correlation between all pairs of stocks in an index. Exhibit 2 shows the mean pairwise correlation for the ISC Index over time and compares those values to larger cap indices. The ISC Index has consistently offered the lowest mean pairwise correlation, which tells us that returns on individual index constituents tend to be driven by unique sources. The low correlation is a product of the highly idiosyncratic nature of small cap returns, a feature particularly important now as macroeconomic headlines have come to dominate moves in large cap indices. Additionally, the lower the correlation among constituent stocks, the more total portfolio volatility can be lowered by combining the stocks.
Seeking to exploit the pricing inefficiencies of such a dynamic universe in a risk-conscious manner, the Causeway ISC strategy uses a quantitative approach for stock selection and portfolio construction. We examine the small cap universe along four major bottom-up factor dimensions to gauge return potential. In our view, the ideal candidate will exhibit relatively cheap valuations, accelerating earnings growth prospects, positive technical indicators, and superior competitive strength. We also consider various top-down factors to determine the relative attractiveness of countries. We believe a quantitative approach not only allows for a diversification of alpha sources, but also facilitates rigorous risk management. We use a proprietary risk model to examine each stock’s exposure to over one hundred risk factors. Then we form an optimized portfolio with the highest expected return per unit of risk.
The breadth of the universe means we frequently find stocks that, in our view, contain all the prized characteristics of winning stocks.
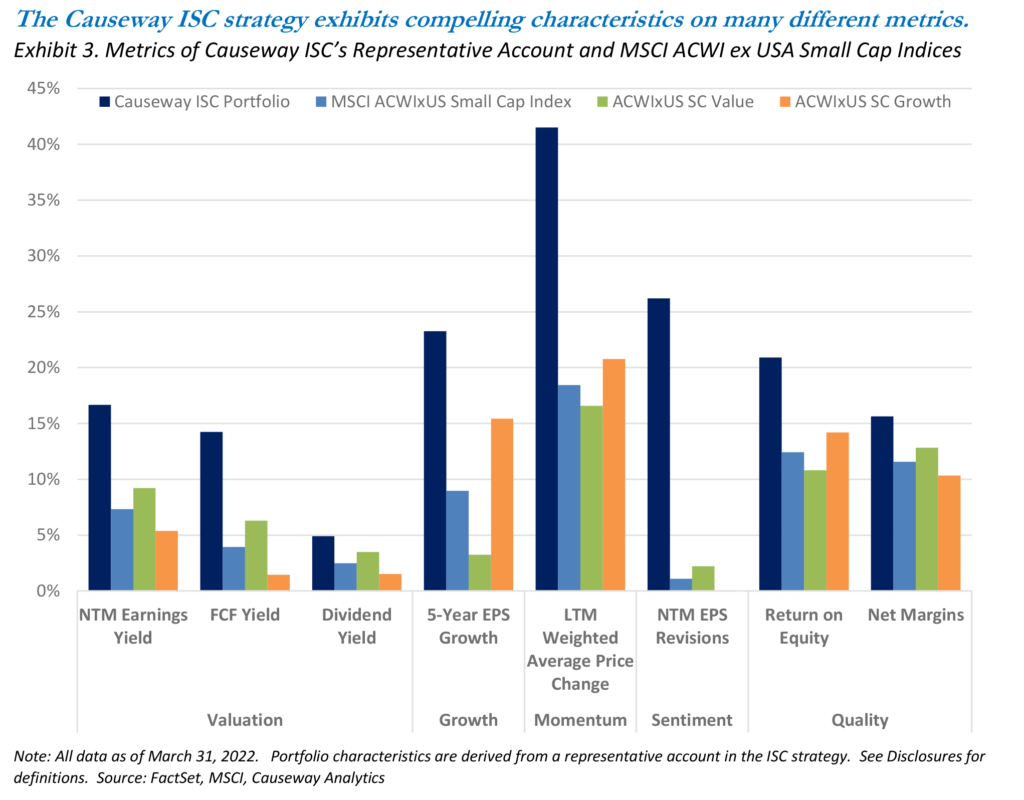
The breadth of the universe means we frequently find stocks that, in our view, contain all the prized characteristics of winning stocks. Exhibit 3 displays the characteristics of Causeway’s ISC portfolio relative to the ISC Index as well as the Value/Growth variants of that Index. Our portfolio exhibits value metrics superior to the value variant of the ISC Index and growth metrics superior to the growth variant of the ISC Index, all while delivering better quality, sentiment, and momentum characteristics. This wide variety of attractive portfolio statistics would be difficult, if not impossible, to achieve in other universes.
Growth is often a critical component in successful small cap stock investing. Nothing pleases us more than to see our portfolio companies increase their market value and eventually “graduate” to larger cap indices. But in a universe with far fewer tradeoffs, why ignore valuation? High valuation is always a risk, and that risk is elevated in the current market environment. With interest rates on the rise, one cannot afford to wait around years for positive cash flows.
In a universe with far fewer tradeoffs, why ignore valuation?
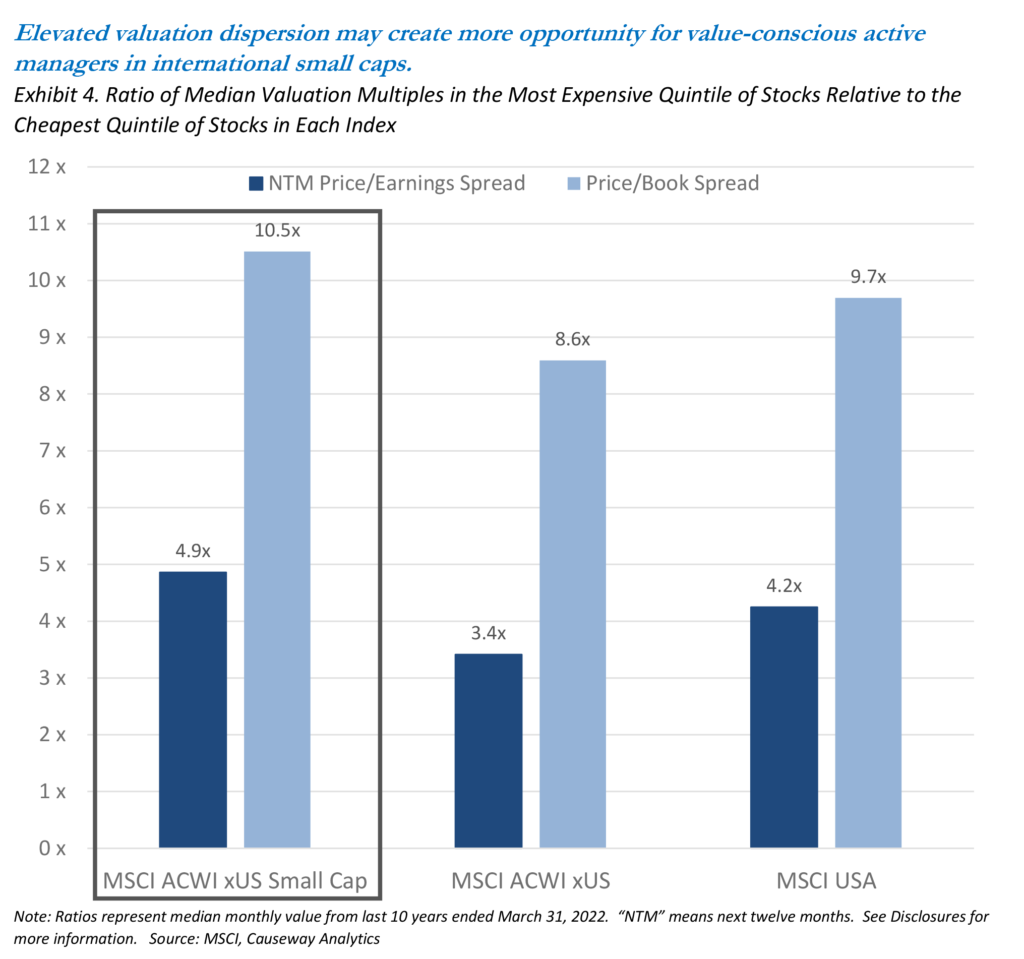
In the ISC universe, the difference in valuation multiples between the cheapest and most expensive quintiles is typically higher than in certain other larger cap indices. Exhibit 4 compares the valuation dispersion (the ratio of the median multiple in the most expensive quintile to the median multiple in the cheapest quintile) on both a price-to-book-value and price-to-forward-earnings basis. On both measures, the ISC Index has exhibited the highest dispersion in valuation ratios. We believe that the more extreme the dispersion, the greater the opportunities for active management to exploit pricing inefficiencies.
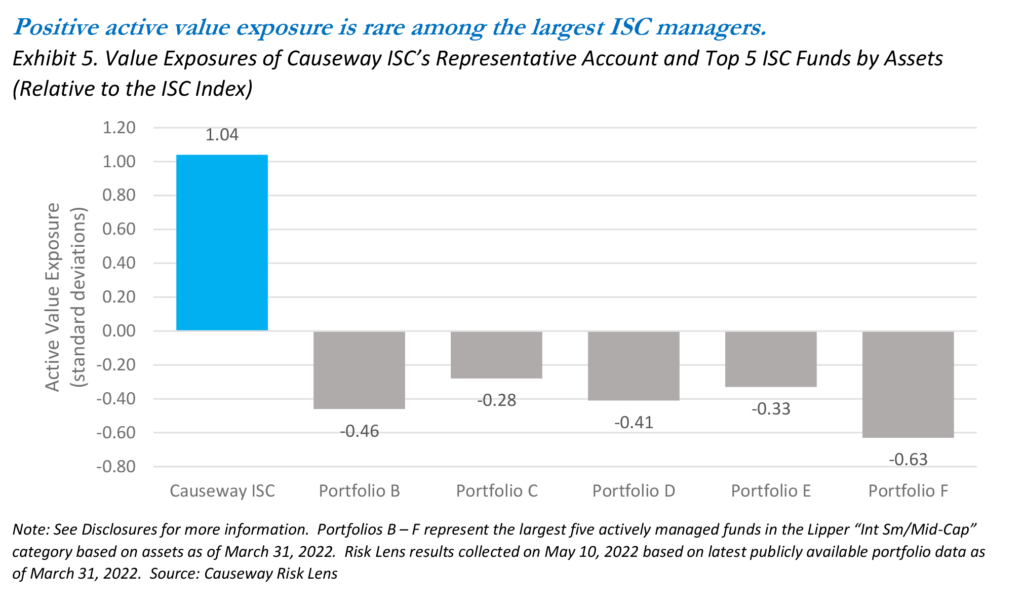
Finding undervalued stocks has always been at the heart of every strategy at Causeway, and valuation is an important part of our ISC alpha model. The ISC universe provides opportunities to construct a value-conscious portfolio that still exhibits strong growth, quality, sentiment, and momentum characteristics. Therefore, it seems unreasonable and risky to us to focus exclusively on growth, regardless of valuation, but it seems that many international small cap managers do exactly that. Using output from Causeway’s Risk Lens, a free investment analysis tool, Exhibit 5 displays our active value exposure (measured in standard deviations vs. the ISC Index) compared to that of the top five ISC mutual funds based on total assets as of March 31, 2022. Causeway’s ISC representative account is the only one among our largest peers with positive value exposure relative to the ISC Index. This value exposure also makes our ISC strategy diversifying if paired with one of the other funds.
As discussed, Causeway’s value posture is part of a balanced approach. Our Competitive Strength factors were created, in part, to help us avoid lower-quality “value traps.” This Competitive Strength framework evaluates trends in a firm’s margins, returns, industry structure, market share, and balance sheet strength. Inexpensive valuations are still an important attribute for investment, but we focus on those value stocks whose competitive fundamentals are strong and are more likely to rerate upward in the future. We believe these are also likely the same stocks with the pricing power to continue delivering strong results even in an inflationary or recessionary environment. Our Momentum factors also work well in the ISC universe because new information takes time to be reflected in prices, especially among small caps. We examine not just the price movements of each stock, but also the momentum of that company’s competitors, partners, customers, and other stocks with industry overlap. Our Earnings Growth factors seek out stocks with improving sentiment in the form of estimate upgrades and the potential for positive future earnings surprises.
The breadth and inefficiency of the international small cap universe make it well suited to active management. We believe that our positive active value exposure, though rare among our peers, is more important than ever in the current market environment, but value is just one of many attributes we seek when selecting stocks. Our quantitative investment process for the Causeway ISC strategy seeks to blend together a diverse group of alpha signals, and we believe we can assemble a portfolio that exhibits better-than-index characteristics on a wide variety of metrics.
Disclosures
This paper expresses the portfolio managers’ views as of May 2022 and should not be relied on as research or investment advice regarding any stock. These views and any portfolio holdings and characteristics are subject to change. There is no guarantee that any forecasts made will come to pass.
Investing involves risk, including possible loss of principal. In addition to the normal risks associated with equity investing, international investing may involve risk of capital loss from unfavorable fluctuations in currency values, from differences in generally accepted accounting principles, or from economic or political instability in other nations. Emerging markets involve heightened risks related to the same factors, as well as increased volatility and lower trading volume. Investments in smaller companies involve additional risks and typically exhibit higher volatility.
The MSCI ACWI ex USA Small Cap Index captures small cap representation across 22 of 23 developed markets (excluding the US) and 24 emerging markets. With 4,334 constituents, the index covers approximately 14% of the global equity opportunity set outside the US. The MSCI ACWI ex USA Small Cap Value Index captures small cap securities exhibiting overall value style characteristics. The value investment style characteristics for index construction are defined using three variables: book value to price, 12-month forward earnings to price and dividend yield. The MSCI ACWI ex USA Small Cap Growth Index captures small cap securities exhibiting overall growth style characteristics. The growth investment style characteristics for index construction are defined using five variables: long-term forward EPS growth rate, short-term forward EPS growth rate, current internal growth rate and long-term historical EPS growth trend and long-term historical sales per share growth trend. The MSCI ACWI ex US IMI Index captures large, mid and small cap representation across 22 of 23 Developed Markets countries (excluding the United States) and 24 Emerging Markets countries. With 6,645 constituents, the index covers approximately 99% of the global equity opportunity set outside the US. The MSCI EAFE Index is a free float-adjusted market capitalization weighted index, designed to measure developed market equity performance excluding the U.S. and Canada, consisting of 21 stock markets in Europe, Australasia, and the Far East. The MSCI World Index captures large and mid cap representation across 23 Developed Markets countries. The MSCI World ex USA Index captures large and mid cap representation across 22 of 23 Developed Markets countries excluding the United States. With 913 constituents, the index covers approximately 85% of the free float-adjusted market capitalization in each country. The MSCI ACWI ex USA Index captures large and mid cap representation across 22 of 23 Developed Markets countries (excluding the US) and 24 Emerging Markets countries. With 1,856 constituents, the index covers approximately 85% of the global equity opportunity set outside the US. The MSCI Emerging Markets Index is a free float-adjusted market capitalization index, designed to measure equity market performance of emerging markets, consisting of 24 emerging country indices. The MSCI USA Index is a free float-adjusted market capitalization weighted index, designed to measure large- and mid-cap US equity market performance. The MSCI USA Index is member of the MSCI Global Equity Indices and represents the US equity portion of the global benchmark MSCI ACWI Index. The Indices are gross of withholding taxes, assume reinvestment of dividends and capital gains, and assume no management, custody, transaction or other expenses. It is not possible to invest directly in these indices.
The MSCI ACWI ex USA Small Cap Index was launched on June 1, 2007. The MSCI ACWI ex USA Index and MSCI Emerging Markets Index were launched on January 1, 2001. Data prior to the respective launch dates were backfilled by MSCI.
The Causeway international small cap strategy uses quantitative factors that can be grouped into six categories: valuation, earnings growth, technical indicators, competitive strength, macroeconomic, and country. The relative return attributed to a factor is the difference between the equally-weighted average return of the highest ranked quintile of companies in the strategy’s universe based on that factor and that of the lowest ranked quintile of companies. “Alpha” is a measurement of performance return in excess of a benchmark index.
NTM earnings yield is analysts’ estimated earnings per share for the next twelve months divided by the current market price per share. FCF yield is free cash flow per share divided by the current share price. Dividend yield is dividends paid divided by share price. LTM weighted average momentum is the portfolio-weighted average share price change over last twelve months. NTM EPS revisions is analysts’ estimated next twelve months earnings per share revisions. 5-year EPS growth is the slope of a linear regression using the last 5 years of reported EPS. Return on equity is net income divided by shareholders’ equity, and is calculated as a weighted average, winsorized using maximum Return on Equity figures at 3 standard deviations from the mean (winsorization is a statistical technique intended to remove the impact of outliers). Net margins are net profits divided by total revenue X 100. NTM price/earnings spread is analysts’ estimated price per share divided by earnings per share for the next twelve months. Price/book spread is current price per share divided by book value per share. Characteristics are weighted averages of companies in the ISC representative account and indices.
Causeway Risk Lens is a free investment analysis tool that shows active style, sector, and geographic exposures for stock funds. It shows top risk exposures, top stock weights, and forecast risk measures, calculates Causeway Fiduciary ESG Scores, and predicts fund return correlations. See analytics.causewaycap.com for analysis covering over 9,000 U.S.-registered stock mutual funds and ETFs and over 38 benchmarks and ETFs across all major geographies.
Causeway Risk Lens is For Investment Professional Use Only.
Causeway Risk Lens is for illustration only. It is not intended to be relied on for investment advice. The risk comparisons are calculated by Causeway’s model as of the reference date and are subject to change. Results may vary with each use and over time. There is no guarantee that any forecasts made will come to pass. Important disclosures accompany Causeway Risk Lens reports, and should be reviewed carefully. In particular, the projections or other information generated by Causeway Risk Lens investment analysis tool regarding the likelihood of various investment outcomes are hypothetical in nature, do not reflect actual investment results and are not guarantees of future results.
Risk Model. Causeway’s risk model analyzes multiple factors for each fund holding (excluding certain portfolio ETFs, fixed income, and commodities and other derivatives) to calculate the fund’s style exposures, forecast the fund’s volatility, and forecast the fund’s beta.
Active Style Exposures. The universe is all equity securities globally with average daily trading volume over the prior 90 days above $500,000. Every security in the universe is scored on each of 8 style dimensions. These standardized scores range from +3 to -3, with a score of 0 being equal to the weighted average score across the universe, +3 being most representative of the style, and -3 being least representative of the style. Fund style exposures are the weighted average of the style scores of all fund holdings. Value, Long-term growth, leverage, liquidity, and size style scores are calculated relative to country. Momentum, volatility, and cyclicality style scores are calculated on a global basis. Active style exposures measure the difference between the fund style exposures and the benchmark style exposures.
IMPORTANT: The projections and other information generated by Causeway Risk Lens investment analysis tool regarding the likelihood of various investment outcomes are hypothetical in nature, do not reflect actual investment results and are not guarantees of future results.
Certain Risk Lens software is subject to ©2022 Causeway Capital Management LLC. All Rights Reserved
MSCI has not approved, reviewed or produced this report, makes no express or implied warranties or representations and is not liable whatsoever for any data in the report. You may not redistribute the MSCI data or use it as a basis for other indices or investment products.
