Contact Us
Subscribe to Causeway Insights, delivered to your inbox.
Risk Metrics that Matter: Predicted Volatility, Tracking Error, and Beta
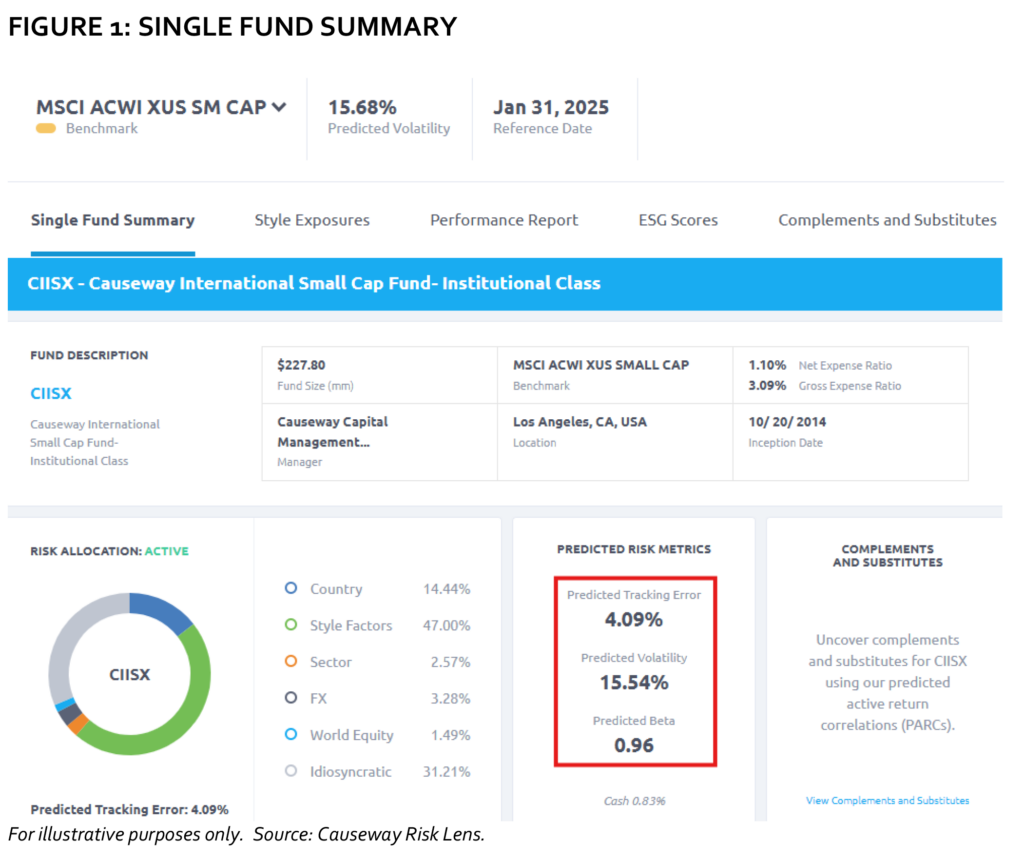
In portfolio management, three key risk metrics are volatility, tracking error, and beta. When a user inputs a fund and benchmark index into Causeway Risk Lens – our free, cloud-based investment analysis tool – it provides estimates for predicted volatility, predicted tracking error, and predicted beta.
Causeway quantitative portfolio manager MacDuff (“Duff”) Kuhnert spoke with Turner Swan, chief operating officer of Risk Lens, about these measurements and why they matter.
VOLATILITY
TS: Duff, let’s start with volatility. What is it and why is it important?
DK: Simply put, volatility is how much a fund’s return fluctuates around its average return. In the fund world, volatility is typically measured as the annualized standard deviation of fund returns. The higher the volatility, the higher the risk of the investment portfolio. We believe it is important because volatility is the most obvious indicator of uncertainty.
Statistically, normal returns fall on a bell curve where about 68% of returns will fall within 1 standard deviation, 95% will fall within 2 standard deviations, and 99.7% will be within 3 standard deviations of the average.
TS: Causeway has a long-standing proprietary risk model that projects portfolio volatility, which we have deployed in Risk Lens to estimate future volatility for a wide universe of funds. What does the predicted volatility tell us here?
DK: In Figure 1, the predicted volatility of Causeway International Small Cap Fund (CIISX) is 15.54%. So that would mean about 68% of the time, its investment return would be within 15.54 percentage points of its average investment return.
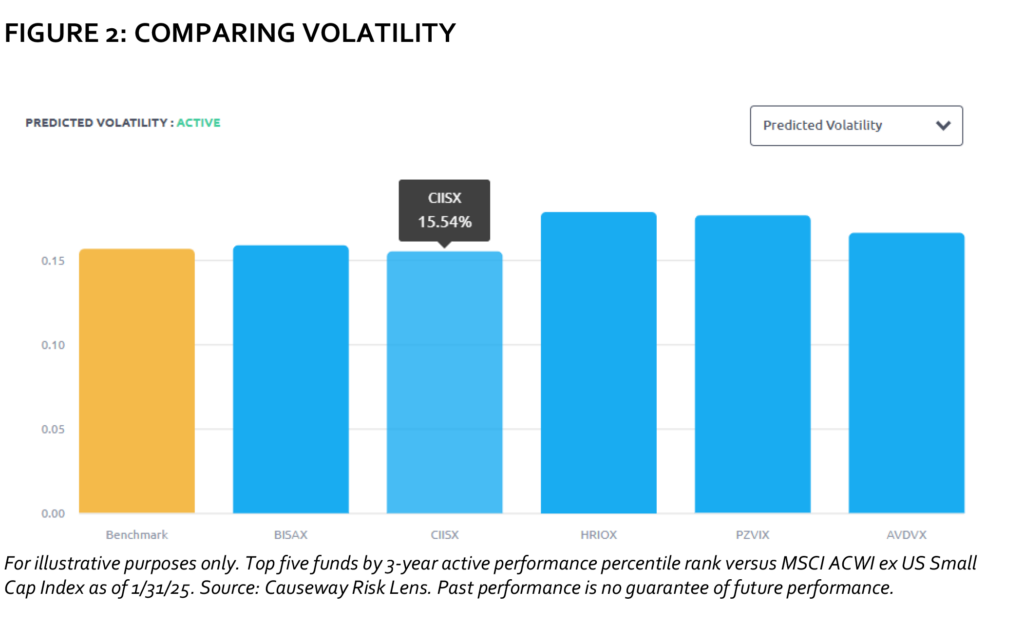
Of course, for advisers and investors picking money managers, the real power is comparing volatility among multiple funds to assess risk levels, like Risk Lens does in Figure 2 below.
Figure 2 compares the volatility of five top performing funds as of January 31, 2025 that are benchmarked to the ACWI ex US Small Cap Index. Causeway International Small Cap Fund’s predicted volatility is slightly below that of the other 4 funds and the index, based on publicly available holdings at January 31, 2025.
 TS: Can you tell us more about how Risk Lens “predicts” volatility?
DK: Our proprietary risk model identifies the current risk factor exposures of each of the latest publicly available stocks held by a fund. These exposures are characteristics of the underlying stocks – such as style (like value/growth and large-cap/small-cap), geographic location, economic sector, and currency exposure. The risk model also analyzes the historical “covariance matrix” of our risk factors – basically, how the returns to the risk factors have correlated and fluctuated over time.
Using this information, we assess the contribution to volatility for each factor and for each stock – plus idiosyncratic risk estimates that are stock-specific and not captured by the risk factors. Based on the portfolio’s aggregate factor exposures and the estimates of idiosyncratic risk, the risk model predicts the volatility of each fund going forward.
TS: The realized past volatility of a fund might not be a good predictor of its future volatility since its portfolio holdings have likely changed. So Risk Lens “predicts” future volatility by analyzing the latest publicly available portfolio holdings.
DK: Many analysis tools show past volatility, but Risk Lens seeks to predict future volatility, which we think is more important to advisers and asset managers trying to figure out the risk a fund will have in the future. In that sense, Risk Lens is forward-looking, which we believe is unlike most other investment analysis tools.
TRACKING ERROR
TS: So volatility concerns how much a fund’s returns fluctuate around its average return. What about tracking error?
DK: Tracking error is like volatility in that it measures return fluctuations. But instead of measuring how much a fund fluctuates around its own average return, tracking error measures how much a fund fluctuates around its benchmark index.
TS: Why is tracking error important?
DK: A lower tracking error means a fund is “tracking” closer to its benchmark than a fund with a higher tracking error. Passive funds, which are designed to match a benchmark index, will typically have very low tracking errors; in fact, they will target a tracking error as close to 0% as possible. Actively managed funds, on the other hand, should have higher tracking errors. Many managers primarily define risk as tracking error because their performance is evaluated relative to a benchmark.
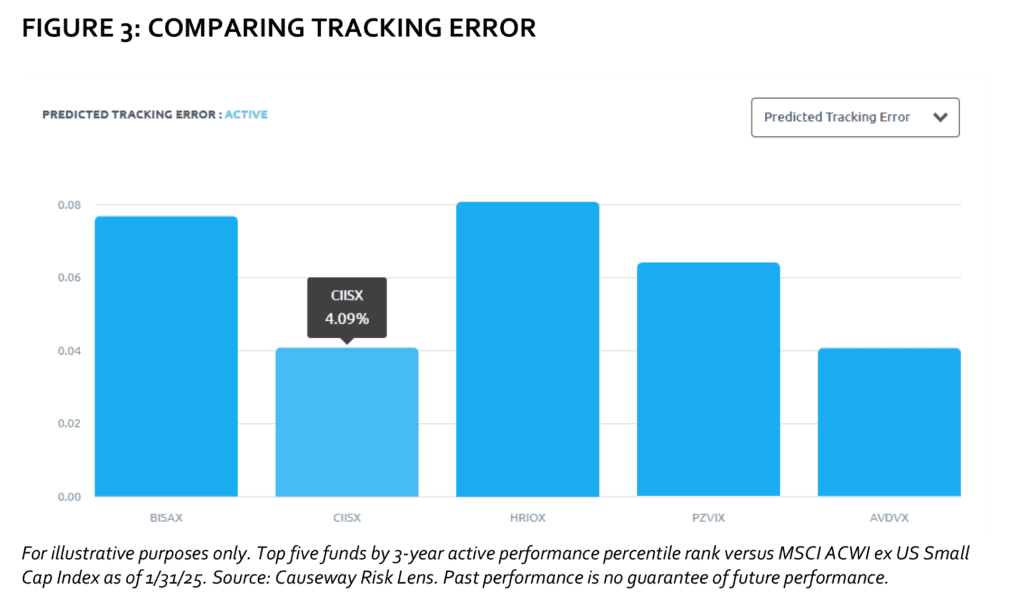
TS: Then for passive and other managers who mainly define risk as tracking error, the higher the tracking error, the higher their portfolio risk. In Risk Lens, users can easily compare predicted tracking errors of multiple funds, as shown in Figure 3.
TS: As with volatility, Risk Lens shows “predicted” tracking error, which would be forward-looking, correct?
DK: Yes. Similar to predicted volatility, we use our risk model to calculate predicted tracking error. The risk model analyzes each stock’s risk exposures in both the portfolio and the benchmark, the historical covariance matrix of the risk factor returns, plus idiosyncratic risk estimates to predict the tracking error of each portfolio.
TS: Again, looking at the realized past tracking error of a fund might not be a good predictor of its future tracking error. But using the latest publicly available portfolio holdings, Risk Lens predicts the portfolio’s tracking error going forward.
DK: That’s why we think forward-looking risk measurements are more meaningful to advisers building portfolios of funds for their clients, because they will care more about how a fund’s risk is expected to be in the future rather than the fund’s past risk.
BETA
TS: Let’s take a look finally at beta.
DK: Beta measures sensitivity to the benchmark index. It includes how fund volatility compares to benchmark volatility and has a correlation component. You simply divide the volatility of the portfolio by the volatility of the benchmark and then multiply that value by the correlation value.
TS: Well that’s the under-the-hood quant version. Can you give us an example of what beta tells us in simpler terms?
DK: Beta measures the magnitude of returns to expect when the benchmark moves up or down. A beta of 1.0 would imply the fund would move exactly the same amount as the benchmark, up or down. This is typically true of index funds. If the fund beta were 2.0, we would expect it to move twice as much as the index. If the index gains 10%, then we would expect the fund to gain 20%. If the index falls 10%, we would expect the fund to fall 20%. On the other hand, if the beta is 0.5, we would expect the fund to move only half as much as the index moves, both up and down.
TS: Again, we use “predicted” beta right?
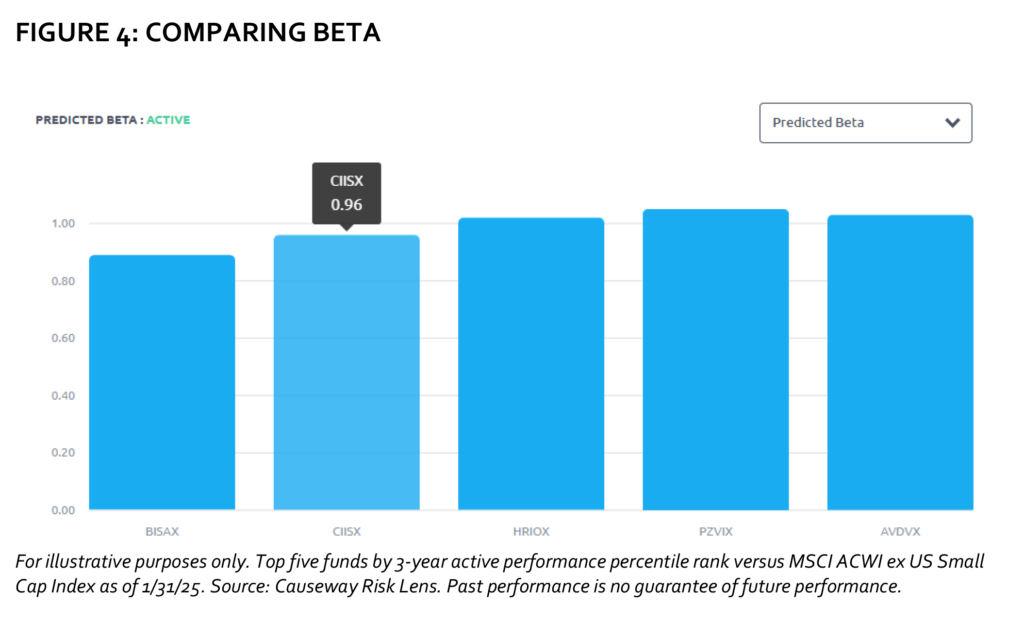
DK: That’s correct. Risk Lens uses “predicted” beta using our risk model, like we do with volatility and tracking error, because we want to be forward-looking on this risk metric as well. Probably the most powerful way to use betas is to compare them among funds you’re analyzing. Figure 4 shows how Risk Lens compares predicted betas of multiple funds.
TS: Duff, thank you for your insights on predicted volatility, tracking error, and beta, and how Risk Lens makes it so easy to analyze these metrics.
To sign up for Risk Lens, go to analytics.causewaycap.com.
Important Disclosures
About Risk Lens: Causeway manages global equities, fusing fundamental and quantitative analysis since 2001 and manages $49.6 billion (at 12/31/24). In 2013, Causeway launched Risk Lens to bring the power of its risk model to clients, introducing the easy-to-use web application in 2019. Risk Lens covers approximately 3,700 U.S.-registered equity mutual funds and ETFs, approximately 9,500 share classes, and 37 benchmarks across all major geographies.
Risk Lens is For Investment Professional Use Only – Not For Retail Distribution. See “Disclosures” in your Risk Lens reports.
IMPORTANT: The projections or other information generated by Causeway’s Risk Lens investment analysis tool regarding the likelihood of various investment outcomes are hypothetical in nature, do not reflect actual investment results, and are not guarantees of future results. The information provided by Risk Lens is for illustration only, should not be relied on as investment advice, and is not a recommendation to buy or sell any fund or security. Results may vary with each use and over time.
This commentary expresses Causeway’s views as of March 2025 and should not be relied on as research or investment advice regarding any stock. These views and any portfolio holdings and characteristics are subject to change.
To determine if a Causeway Fund is an appropriate investment for you, carefully consider the Fund’s investment objectives, risk factors, charges and expenses before investing. This and other information can be found in the downloadable full or summary fund prospectus, which may also be requested in print by calling 1-866-947-7000. Please read the full or summary prospectus carefully before you invest or send money.
The performance data quoted represents past performance. Past performance does not guarantee future results. The investment return and principal value of an investment will fluctuate so that an investor’s shares, when redeemed, may be worth less than their original cost and current performance may be lower than the performance quoted. Returns greater than one year are average annual total returns. Total returns assume reinvestment of dividends and capital gains distributions at net asset value when paid. Active return is the difference between a fund’s return and the benchmark’s return. The average annual total return as of 12/31/24 for CIISX was 10.0%, 9.1%, 7.8%, and 7.9% for the past one-year, five-year, ten-year, and since inception (10/20/14) periods, respectively. For performance as of the most recent month-end, call 1-866-947- 7000. CIISX investment performance reflects fee waivers. In the absence of such fee waivers, total return would be reduced. Total annual fund operating expenses for CIISX (Institutional Class shares) are 1.21% before and 1.10% after investment adviser fee waivers. Total annual fund operating expenses for CVISX (Investor Class shares) are 1.44% before and 1.35% after investment adviser fee waivers. The waivers are contractual and in effect until 1/31/2026. Investor Class shares charge up to a 0.25% annual shareholder service fee.
Mutual fund investing involves risk, including possible loss of principal. In addition to the normal risks associated with equity investing, international investing may involve risk of capital loss from unfavorable fluctuations in currency values, from differences in generally accepted accounting principles or from social, economic or political instability in other nations. Emerging markets involve heightened risks related to the same factors as well as increased volatility and lower trading volume. Current and future holdings are subject to risk. There is no guarantee that any securities mentioned will remain in or out of a Fund. Investments in smaller companies involve additional risks and typically exhibit higher volatility. Diversification does not prevent all investment losses.
Causeway Capital Management LLC serves as investment adviser for the Causeway Funds. The Funds are distributed by SEI Investments Distribution Co. (1 Freedom Valley Drive, Oaks, PA 19456), which is not affiliated with the Causeway Funds or the investment adviser. Check the background of SEI Investments Distribution Co. on FINRA’s BrokerCheck.
There is no guarantee that the Causeway Funds will meet their stated objectives. The Causeway Funds are available to US investors only.
The MSCI ACWI ex USA Small Cap Index, is a free float-adjusted market capitalization weighted index, designed to measure the equity market performance of developed and emerging markets excluding the U.S. market. The Index covers approximately 14% of the free float adjusted market capitalization in each country. The Index is gross of withholding taxes, assumes reinvestment of dividends and capital gains, and assumes no management, custody, transaction or other expenses. It is not possible to invest directly in an index.
MSCI has not approved, reviewed, or produced this report, makes no express or implied warranties or representations and is not liable whatsoever for any data in the report. You may not redistribute the MSCI data or use it as a basis for other indices or investment products.
Certain Risk Lens software is subject to © 2025 Causeway Capital Management LLC. All Rights Reserved.
