Contact Us
Subscribe to Causeway Insights, delivered to your inbox.
How is your investment manager “spending” your portfolio’s risk budget? Is your investment manager pursuing a strategy “true to label”? How concentrated are your portfolio exposures (to specific stocks, sectors, countries, or styles)? And, how does your manager’s strategy complement or replicate other strategies? These questions can only be answered with the right tools. The Causeway Risk Lens is one such tool that we share with our clients. Using portfolio holdings, we can make a variety of risk predictions and disaggregate portfolio risks across idiosyncratic and systematic factor groups. This provides the investor transparency into the specific factors a manager or strategy is most heavily exploiting at the portfolio level. Exposure information is also useful in identifying the risks most critical to producing returns and forecasting the regimes in which a strategy may succeed or underperform.
The obvious first question is how do we define risk? Despite multiple definitions, we believe volatility and volatility of active returns are the best representations of risk because volatility is perhaps the most obvious manifestation of uncertainty. Higher-volatility stocks reflect the presence of greater uncertainty surrounding the future prospects of a company and therefore greater uncertainty regarding fair valuation. But it’s not enough for a manager to claim that the return potential of all stocks in a client’s portfolio exceeds the risks. Such a position-by-position approach to risk management diminishes the ability to control portfolio-level risks that ultimately drive returns.
“Risk” means different things to different investors. Warren Buffett has said that “risk comes from not knowing what you’re doing.” At Causeway, we believe Buffett’s statement applies to risk management itself. Modern portfolio theory tells us that risk and returns are inextricably linked, and that returns are ultimately the compensation for accepting uncertainty. Better understanding and management of risk should therefore yield a superior return stream in the long run. Conversely, managers who fail to understand and control the particular risks that drive their returns will not know if their investors have received fair compensation for taking on risk, and will likely struggle to produce consistent returns.
Given the multi-dimensional nature of risk, we take a more comprehensive approach. A variety of factors simultaneously affects returns, and buying a stock implies buying a basket of risks with uncertain payoffs. Many of these risks are idiosyncratic to an individual company: Will a biotech firm’s new drug be approved by the Food and Drug Administration?
Will a cost-cutting initiative translate into increased earnings? Will a new smartphone succeed in capturing market share from a competitor? How will the latest recall impact a car manufacturer’s stock price? Active managers typically seek to exploit these types of company-specific/idiosyncratic risks through stock selection. When searching for trading opportunities, they largely focus on how company-specific issues are impacting valuation.
However, other forces also impact stock prices. A large number of additional systematic risks will apply to groups of similar stocks. The size of these groups can vary from a handful of competitors to an entire sector or market. These systematic factors have the potential to move stocks more significantly than idiosyncratic factors: What happens to euro-denominated stocks if Greece leaves the Eurozone? How well do defensive stocks protect the investor in various market regimes? How much riskier is one currency over another? What if concerns over valuations cause a market-wide correction in equity prices? How does slowing global growth affect the premiums paid for stocks exhibiting strong earnings growth?
One can research a specific company inside and out, but ultimately many of the elements affecting a stock’s future are outside the influence of that company’s management. A potentially large portion of a stock’s expected return derives instead from its exposures to these systematic factors and how these factors interact. A manager must therefore simultaneously account for all risks of all stocks in the portfolio and understand how these risks interact and aggregate at the portfolio level. We believe the best way to do this is by quantitatively decomposing portfolio risk. The manager must understand which factors contribute the most to portfolio volatility (and comprise the largest potential sources of return) in order to obtain appropriate compensation for the risks assumed. Otherwise, there is the potential for excessive factor concentration or unintended factor dependence that may lead to underperformance. For the investor, confirming that a manager is running a portfolio “true to label” eases the burden of balancing multiple strategies.
II. Causeway’s Risk Model
How do we approach the decomposition of portfolio risk? We start by identifying systematic sources of risk. The Capital Asset Pricing Model (CAPM) was the first model to assume that expected returns are not entirely specific to an individual stock. According to CAPM, a portion of a stock’s expected return is due to its systematic covariance with the market’s return (the stock’s “beta”). Since CAPM was developed, research has uncovered additional systematic factors that influence expected returns beyond the market’s movements, and multi-factor risk models are better equipped to account for the many sources of risk. Factor models will differ in the choice of factors included as well as how loadings and returns are calculated. But at their core, all multi-factor risk models involve analyzing factor returns, a portfolio’s factor loadings (or risk exposures), and the returns attributable to these loadings.
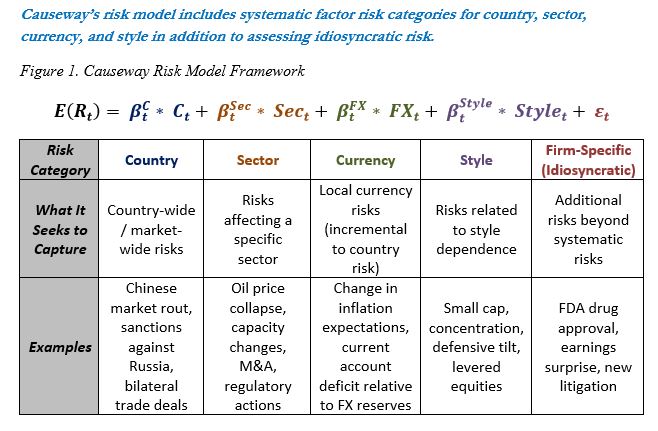
Causeway’s proprietary risk model includes factor categories for country, currency, sector, and style in addition to assessing idiosyncratic risks not captured by the common factor categories. In the context of global equities, portfolios can have exposure to many markets (in the form of different countries/currencies). Sector membership will create incremental divergence from market averages and add to variation in returns. Finally, there are style exposures, on which much of systematic factor research has focused. Size, value, growth, and cyclicality are just a few style attributes of stocks which will influence returns. Expected stock returns are then derived from the sum of the products of all factor premiums and factor exposures. In Causeway’s case, this equation takes the form of the equation in Figure 1.
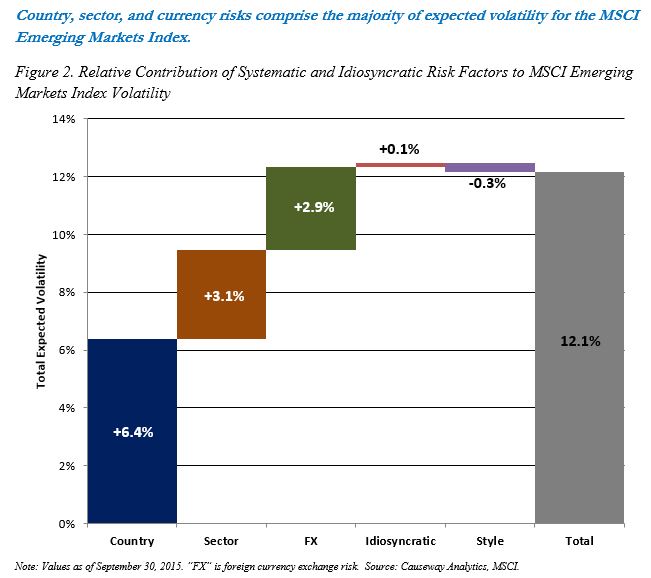
Once we know the weight of all positions in a portfolio, we can aggregate the factor loadings of individual stocks across the entire portfolio. From there, we can examine the contributions of individual stocks, factors, and factor groups to total volatility and tracking error (volatility relative to a benchmark). For example, let’s examine the MSCI Emerging Markets Index (Emerging Markets Index) and break down expected volatility into the major factor groups. Figure 2 illustrates how these groups contribute to total expected portfolio volatility of 12.14% (as of September 30, 2015). You’ll see that country, sector, and foreign exchange risks contribute the most to portfolio risk. Idiosyncratic (or stock-specific) and style risks add a negligible amount of risk. Because the Emerging Markets Index is extremely well-diversified, idiosyncratic risks effectively cancel themselves out at the overall index level. And finally, in the case of the Emerging Markets Index specifically, style exposures only have a modest impact on total risk.
For actively managed strategies, especially those that are benchmark-aware, active risk, a measure of strategy risk in relation to benchmark risk, is relevant as well. Active returns, or alpha, are ultimately derived from active risk, or out-of-benchmark exposures. A concise summary of those active exposures allows us a closer look into a strategy. The relative composition of active risk will reveal how the manager is “spending” the portfolio’s risk budget.
III. Causeway Risk Lens Output and Interpretation
The Causeway Risk Lens offers many insights into a strategy, and highlights differences among multiple portfolios. It can be used by an investor to confirm, or refute, that managers are indeed pursuing the strategy advertised. It can allow the investor to determine the relative magnitude of portfolio risks and identify any potential sources of excessive concentration (to specific stocks, countries, sectors, currencies, or styles). And it can provide a measure of similarity between competing portfolios and gauge whether two portfolios will complement each other.
The typical Causeway Risk Lens report has multiple pages of detail. We provide a “user’s manual” below, and suggest how to interpret the results. The snapshots below are provided for illustration only, and should not be read outside of the context of a complete report, including the important disclosures accompanying the report. Note, in particular, that the projections or other information generated by Causeway Risk Lens investment analysis tool regarding the likelihood of various investment outcomes are hypothetical in nature, do not reflect actual investment results and are not guarantees of future results.
A. Summary Page (Page 1)
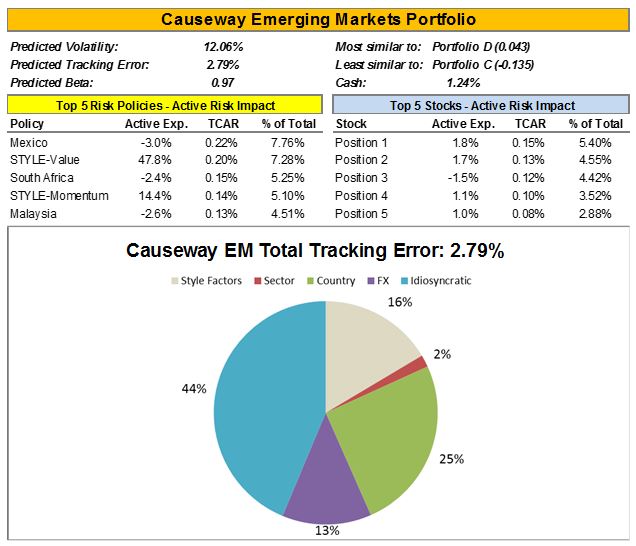
The summary page begins with aggregated estimates for predicted volatility, predicted tracking error, and predicted beta. It also lists the top five systematic and top five stock-level contributors to total active risk. “TCAR” is short for “Total Contribution to Active Risk,” and “% of Total” represents that factor’s share of predicted tracking error for the portfolio. One can think of the top systematic risks as the overriding “risk policies” of a portfolio, and the top idiosyncratic risks will generally correspond to the largest active stock positions (overweight or underweight versus the benchmark). These largest contributors to active risk should have a high likelihood of being the primary generators of active returns, but they simultaneously represent the greatest vulnerabilities of the strategy. If these stocks or factors underperform, the portfolio will likely underperform as well. Finally, the pie chart at the bottom breaks down total active risk (tracking error) into the major risk factor categories.
B. Risk Statistics Page (Page 2)
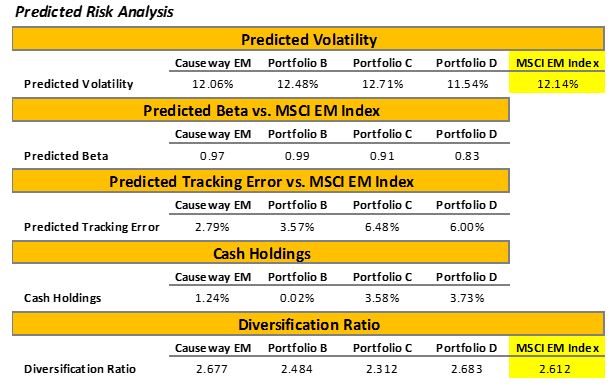
The risk statistics page begins with the portfolio-level estimates for predicted volatility, predicted tracking error, and predicted beta for each of the portfolios considered. Cash Holdings provide an indication of whether the portfolio remains fully invested or not. The Diversification Ratio represents the weighted average volatility of individual positions divided by total portfolio volatility. It measures the level of diversification, where a high number represents a more diversified portfolio (extracting more benefits from diversification).
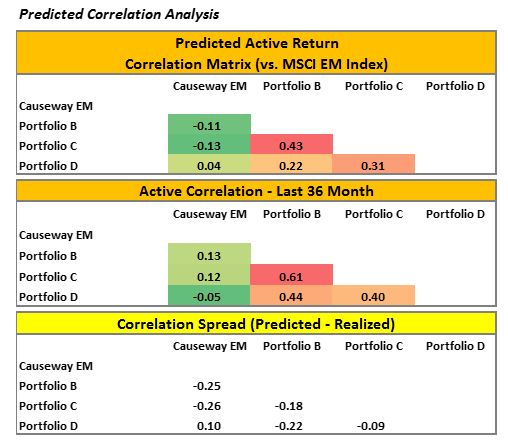
Following the Diversification Ratio are a series of data points which reveal the similarity of the portfolios under review. The predicted active return correlation matrix is based on each portfolio’s aggregate factor exposures and the expected covariance of these factors. Therefore, it is forward looking in seeking to forecast correlations. In contrast, the “Active Correlation – Last 36 Months” is the actual, realized correlation of active returns over the previous three years. The “Correlation Spread” below that simply takes the differences between these correlation scores to examine any radical shifts between past correlations and expected correlations due to a possible strategy shift or otherwise.
Below these tables appears active share (excluding cash) for each portfolio relative to the benchmark index. Despite becoming a very popular statistic in the past few years, we highlight a few issues with putting too much emphasis on active share. The calculation for active share measures deviations from benchmark weights. The popular perception is that these deviations result from superior stock selection, but a high active share may capture something else. If the benchmark is not an appropriate passive comparison, active share will be high (e.g., a developed markets manager with significant emerging markets exposure). Computed according to the strict definition of active share, cash, ETFs, and ADRs will all increase active share even if the underlying equities are members of the benchmark (Note that the Causeway Risk Lens maps back ADRs and ETFs to their underlying index constituents). If the portfolio is highly concentrated, active share will also be high. And concentration need not refer to specific stocks either. A high active share may result from one major top-down factor decision as opposed to many independent, stock-level decisions. For example, a manager may have a large overweight to India versus the benchmark. This will manifest itself in a high active share, even though it really only reflects one active decision. And factor concentration will result in factor dependence. In this example, if India underperforms within the Emerging Markets Index, that high-active-share strategy will also underperform even if the overweight was spread across many individual Indian equities.
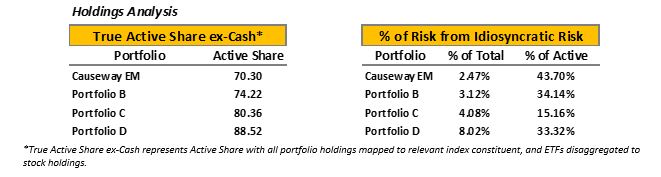
For this reason, in addition to reporting active share, the Causeway Risk Lens reports the percentage of active risk attributable to idiosyncratic risk. If the popular interpretation of active share involves isolating stock selection, we believe this measure will accomplish the goal more effectively. This is because it measures idiosyncratic risk relative to systematic risk. If benchmark differentiation truly arises from stock selection, this percentage will be high. But if high active share only results from a significant policy decision or factor exposure, there may be a sizable difference between active share and the idiosyncratic risk share of total active risk.
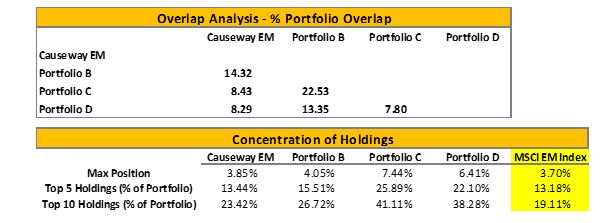
The Overlap Analysis is a more position-specific analysis which captures the active share when comparing two portfolios to each other (as opposed to a portfolio versus the benchmark). A lower number indicates less overlap in actual holdings between portfolios. Finally, at the bottom, appear simple measures of concentration among individual stocks.
C. Style Exposures Page (Page 3)
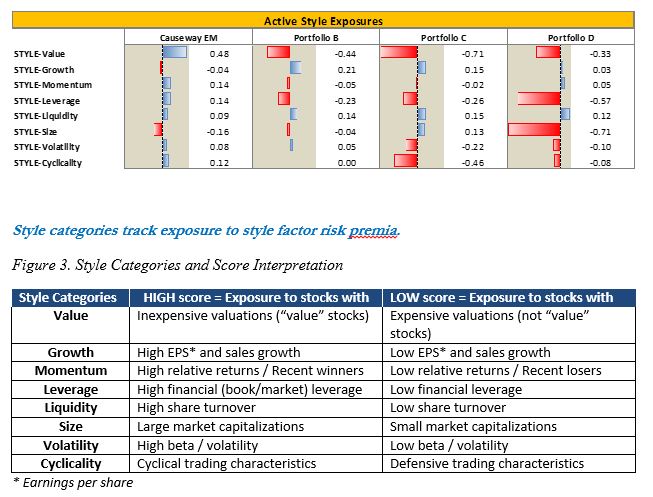
The Style Exposure page makes style exposures transparent by revealing the actual investing styles employed. Generally, these may be less apparent than the simple categorical exposures such as country and sector which are much easier to assess. Exposure magnitudes help us determine the style characteristics of the portfolio relative to the benchmark. Is the portfolio less expensive than the benchmark? Does it invest in smaller-capitalization companies? Is it exploiting a liquidity premium by investing in less-traded names (which may pose a problem in times of market distress)? Does it invest in highly levered companies? Are its portfolio holdings more cyclical or defensive? Since these are all standard deviations relative to the benchmark levels, a positive number signifies greater exposure to that style than the benchmark, and a negative number signifies less exposure. Graphical bars are also illustrated to highlight the largest style tilts (positive or negative). Figure 3 has the full list of styles tracked and details how to interpret a high/positive or low/negative score for each category.
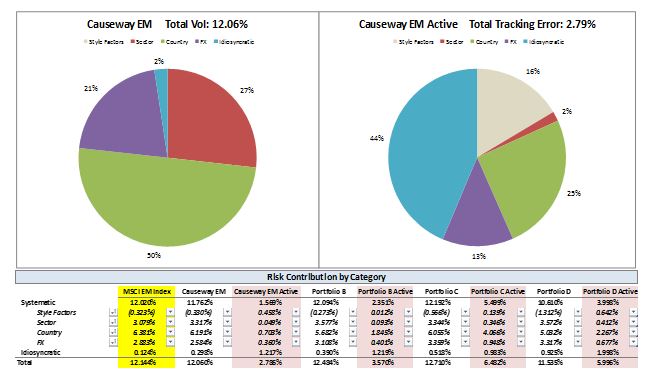
The Top Risk Contributors page breaks down total volatility and tracking error into idiosyncratic and systematic factor categories. Each of these columns sums to total portfolio volatility or tracking error (in the case of the red-shaded, active risk columns). These risk categories can all be expanded to view the full list of all systematic factors and the individual contribution of each on a total and active basis.
The Risk Exposures page details the exposures to each risk factor driving total volatility and tracking error. The percentages represent the relative exposures within each factor group (country, sector, currency, and style) such that the sum of percentages within each factor group should approximate 100% (though cash holdings will cause the total to differ slightly from 100%).
E. Country, Sector, and Currency Exposures Pages (Pages 6-8)
Country, sector, and currency memberships are all binary in nature. Either a stock is a member of those risk categories − or not. Exposure is simply the sum of position weights in the portfolio that meet the membership requirements. Nevertheless, significant deviations from benchmark weights can be illuminating. In the context of an emerging markets strategy, for example, a large weight to the U.S. (outside of the Emerging Markets Index benchmark) will significantly impact relative performance versus the benchmark. Therefore, investors must be comfortable with this and other active “risk policy” decisions.
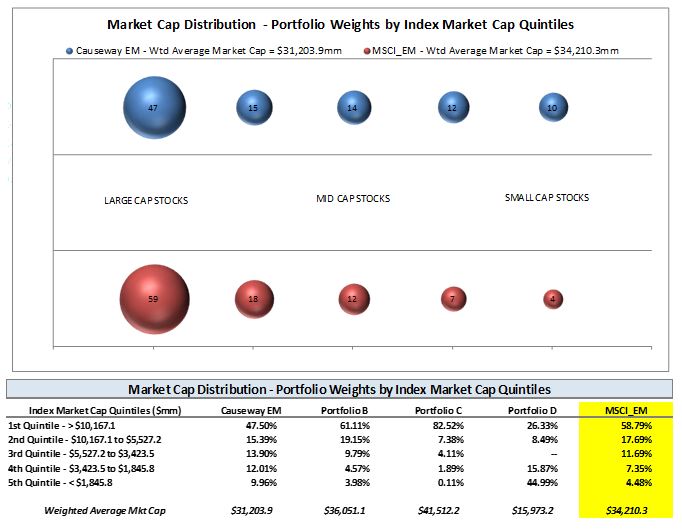
F. Size Distribution Page (Page 9)
Company size (market capitalization) is an important component of style risk. Though the weighted average size exposure of each portfolio appears on the Style Exposures page (Page 3), the Size Distribution page provides more information on specific weight to each size quintile versus the benchmark. Particular attention should be paid to the largest and smallest size quintiles. Significant exposure to the smallest size quintile may raise concerns about overall portfolio liquidity. Trading smaller stocks may take longer to manage the market impact associated with a smaller pool of buyers and sellers. And in a period of market distress, these positions will be even more difficult to liquidate
G.Extreme Risk Model Page (Page 10)
The final two pages of the Causeway Risk Lens provide estimated risk statistics assuming extreme market conditions. Whereas the base case risk model utilizes recent factor return and correlation data, the extreme risk model focuses on the worst 20% of months based on market return from 1995. In extreme market selloffs, typical relationships among factors may change, sometimes radically, and it is helpful to examine estimated risk statistics assuming extreme market conditions. One should pay special attention to any significant changes between the output of the traditional risk model and that of the extreme risk model.
IV. Summary
The Causeway Risk Lens is a valuable tool designed to estimate a portfolio’s expected risk metrics and disaggregate its systematic and idiosyncratic sources of risk. Since returns have been shown to be directly related to risks, a more comprehensive analysis of risk will lead to a better understanding of returns. And knowing the major contributors to aggregate volatility and active risk will highlight the factors that will most heavily influence the subsequent success or underperformance of the portfolio. We believe the Causeway Risk Lens is particularly effective in highlighting similarities and differences among multiple portfolios, permitting investors to make timely assessments of which portfolios best complement each other and which are the closest substitutes.
For more information, and for a demonstration of the Causeway Risk Lens, please contact Eric Crabtree at [email protected] or at (310) 231-6145.
Causeway Risk Lens is an investment analysis tool provided at an investor’s request and is for illustration only. It is not intended to be relied on for investment advice. Important disclosures accompany the Causeway Risk Lens, and should be reviewed carefully. In particular, the projections or other information generated by Causeway Risk Lens investment analysis tool regarding the likelihood of various investment outcomes are hypothetical in nature, do not reflect actual investment results and are not guarantees of future results.
The MSCI Emerging Markets Index is a free float-adjusted market capitalization index that is designed to measure equity market performance of emerging markets. The Index is gross of withholding taxes, assumes reinvestment of dividends and capital gains, and assumes no management, custody, transaction or other expenses. It is not possible to invest directly in an index.
MSCI has not approved, reviewed or produced this report, makes no express or implied warranties or representations and is not liable whatsoever for any data in the report. You may not redistribute the MSCI data or use it as a basis for other indices or investment products.